Explainer
Real Yields and Breakevens: How TIPS Split the 10-Year Yield
The short answer: Real yields and breakevens split a Treasury yield in two: the real yield, read from Treasury Inflation-Protected Securities (TIPS), is the return after inflation, and the breakeven is the nominal yield minus the real yield, roughly the average inflation rate at which the two bonds pay the same. On 26 October 2026 the ten-year Treasury yielded 5.00 per cent, the ten-year TIPS 2.66 per cent and the breakeven 2.34 per cent, and of the 82 basis points the nominal yield has added in 2026, 73 came from the real yield.
The Federal Reserve announces its decision at 18:00 GMT (22:00 Dubai) on Wednesday 28 October 2026, and September PCE inflation follows at 12:30 GMT (16:30 Dubai) on Thursday 29 October. The ten-year Treasury yield stood at 5.00 per cent on Monday 26 October, the latest Treasury reading at the time of writing, after 5.31 on 5 October, its highest since 2002. The split between the real yield and the breakeven shows where the rise came from.
What real yields and breakevens are
| Nominal Treasury and TIPS side by side | ||
| Nominal Treasury note | TIPS | |
| Principal | Fixed | Adjusted by CPI-U (not seasonally adjusted, about a three-month lag); never repaid below the original at maturity |
| Coupon | Fixed rate on fixed principal | Fixed rate on the adjusted principal |
| Its yield measures | Real return plus inflation compensation | Real return only |
| 10-year yield, 26 Oct 2026 | 5.00% | 2.66% |
| Tends to come out ahead if CPI-U averages | Below 2.34% a year | Above 2.34% a year |
| Yields: US Treasury daily par yield curve and par real yield curve, 26 October 2026. 2.34% is the ten-year breakeven, 5.00 minus 2.66, an approximate threshold: par yields are interpolated, not a matched pair of bonds. Mechanics: TreasuryDirect. | ||
The nominal Treasury. An ordinary ten-year note pays a fixed coupon and returns a fixed principal. Its yield has to cover both the return investors demand after inflation and compensation for expected inflation.
The TIPS. The Treasury sells TIPS with 5, 10 and 30-year maturities. Their principal is adjusted by the non-seasonally adjusted Consumer Price Index for All Urban Consumers (CPI-U), with a lag of about three months: it rises with inflation and falls with deflation. The coupon rate is fixed at auction but paid on the adjusted principal, so payments grow with inflation too. At maturity the holder receives the adjusted principal or the original, whichever is greater. Because inflation is paid on top, the yield on a TIPS is a real yield: what the bond returns over and above CPI inflation if held to maturity.
The breakeven. On 26 October, 5.00 minus 2.66 gives 2.34. Roughly, if CPI-U inflation averages more than 2.34 per cent a year over the next ten years, comparable TIPS should come out ahead; if less, the nominal note should. That threshold is where the two break even, hence the name. It is approximate: these are interpolated par yields, not a matched pair of bonds, and cash flows, the indexation lag and the deflation floor differ. It is often called market-implied inflation, though strictly it is inflation compensation.
How it works
The identity is simple: the nominal yield is roughly the real yield plus the breakeven. Every move in a Treasury yield is therefore a move in one, the other or both, and the two parts respond to different forces.
The TIPS yield reflects expected real interest rates over the ten years, a real term premium for the risk of lending that long, and effects specific to TIPS, such as their thinner trading. Policy expectations, growth and Treasury supply can all move it, but the real yield alone cannot say which did; term premium has to be estimated separately, with models. The breakeven carries expected inflation, plus an inflation risk premium, less a liquidity discount because TIPS trade less easily than ordinary notes. It is not a pure forecast, but over days and weeks its direction is informative.
Two cautions. The breakeven is an average over the life of the bond, not this year’s rate: September headline CPI was 3.7 per cent over the year, yet the ten-year breakeven closed at 2.35 on the day it was released. And it is a CPI measure, while the Fed targets PCE inflation; from 2000 to 2019 core CPI ran on average 0.28 percentage points above core PCE, as PCE vs CPI: Two Inflation Gauges and the Wedge Between Them explains. A CPI breakeven a little above 2 per cent is not, by itself, a market doubting the target.
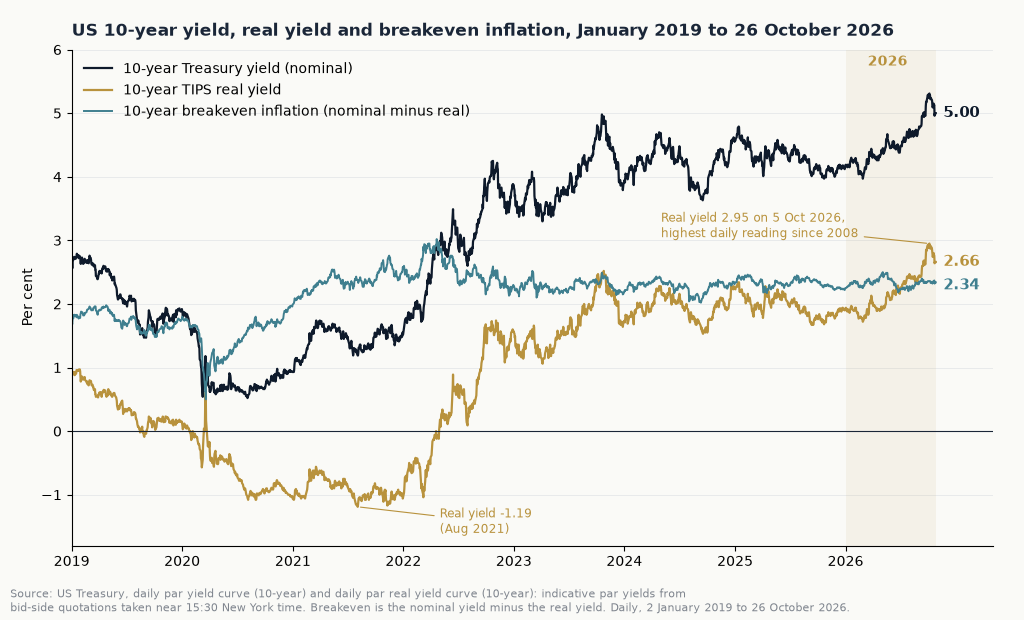
The long view shows what each part does. In August 2021 the ten-year real yield was minus 1.19 per cent: investors accepted a guaranteed loss after inflation. In April 2022 the breakeven peaked at 3.02 and the real yield turned positive as the Fed began raising rates. Since May 2022 the breakeven has stayed between 2.02 and 2.87 while the real yield has done the travelling.
2026 is the clearest case yet. From the lows of 27 February to the highs of 5 October the nominal ten-year rose 134 basis points, from 3.97 to 5.31 per cent. The real yield rose 123, from 1.72 to 2.95, the highest daily reading since November 2008. The breakeven rose 11, and all year it has stayed between 2.18 and 2.50.
Maturities can disagree. On 26 October the five-year breakeven was 2.47, above the ten-year’s 2.34. Together they imply about 2.21 per cent for the five years that start five years from now: the market charges more for inflation in the near term than in the long run.
Why it matters now
The split has shaped how the desk read each large move in Treasuries this autumn.
September’s rise was real. The Fed raised its target range by a quarter point to 3.75 to 4 per cent on 16 September, unanimously. From 10 to 28 September the nominal ten-year rose from 4.95 to 5.24 while the breakeven fell from 2.40 to 2.34; the real yield went from 2.55 to 2.90. The Brief Twelve to Nothing. The Curve Went Further. put it plainly: six basis points off the breakeven against twenty-nine onto the yield was “the whole move and more” in real yield.
Gold followed the real yield. From 20 August to 8 October the ten-year real yield rose 52 basis points, from 2.35 to 2.87, while the breakeven barely moved, 2.34 to 2.35. Over the same weeks gold fell about 7 per cent, as the Brief Gold Lost the Line. The Dollar Kept the Case. recorded. Gold pays no coupon, so a higher real yield raises the cost of holding it; the link is a tendency, not a rule, and the dollar and official buying matter too.
A hot print, a falling real yield. September CPI, released on 14 October, came in hot at 3.7 per cent on the year. The ten-year closed two basis points lower at 5.19, the breakeven rose two to 2.35 and the real yield fell four to 2.84. The Brief The Print Was Hot. The Tape Sold It. scored the desk’s CPI test held and read the move as supply and term premium rather than inflation feeding through, which it called the discriminator’s reading, not a proof.
Since the peak the same pattern has run in reverse. From 5 to 26 October the nominal ten-year fell 31 basis points and the real yield 29, while the breakeven slipped two. Into Wednesday’s decision and Thursday’s PCE, the question is which leg moves: a hawkish surprise would most likely show in the real yield, an inflation scare in the breakeven.
How the desk uses it
The desk decomposes before it interprets. When a long yield moves, the first check is how much is real yield and how much breakeven, because the two point to different scenario paths: a real yield move raises the policy, supply and term premium questions, a breakeven move the inflation and credibility ones.
The breakeven also gets its own registered calls. On 14 September the note The Tide Line set a band for the ten-year breakeven of 2.30 to 2.45, registered at 2.36, the 11 September close. It stayed inside the band throughout and closed 2.33 on 9 October; the entry is marked held on the desk’s call record at /calls, scored by the method in How the Desk Scores Its Calls.
The same note carries a miss that teaches the lesson. Its thirty-year trigger, a close through 5.45 per cent, was meant to move weight to the inflation path. It fired on 24 September with the breakeven falling, and the record scores it missed: “the trigger should have carried a breakeven condition.” A yield level alone could not tell an inflation move from a real yield move.
The open test is the line from Twelve to Nothing: on the desk’s framework, inflation compensation falling while nominal yields rise reads as term premium and supply; a breakeven through May’s 2.50 high would turn it into a credibility problem.
This week, four checks:
- Split the move. After the 18:00 GMT (22:00 Dubai) statement on Wednesday, compare the change in the ten-year nominal yield with the change in the real yield.
- The breakeven thresholds. 2.34 on 26 October. The Tide Line’s 2.30 to 2.45 band was scored held; the open line is May’s 2.50 high, above which the desk’s framework would read the move as a credibility problem rather than supply.
- The five-year against the ten-year. A widening gap says the market’s inflation worry is near term.
- PCE on Thursday. A hot core reading that lifts the breakeven but not the real yield is the 14 October pattern again.
Next in the curriculum: Gold vs Real Yields: Why They Move Together (and When They Don’t) for the asset most often read against the real yield, and Term Premium Explained for how that premium is estimated and why the desk watches it.
Frequently asked questions
What is a real yield?
A real yield is the return on a bond after inflation. In the US it is read from TIPS, whose principal rises with the Consumer Price Index, so their yield is earned over and above inflation. The ten-year TIPS yielded 2.66 per cent on 26 October 2026.
What is the breakeven inflation rate?
It is the nominal Treasury yield minus the TIPS yield of the same maturity: roughly the average annual CPI-U inflation at which the two would return the same. The ten-year breakeven was 2.34 per cent on 26 October 2026.
Is the breakeven a forecast of inflation?
Not exactly. It includes an inflation risk premium and is reduced by a liquidity discount on TIPS, so it is a price for inflation protection rather than a pure forecast. Its changes are more informative than its precise level.
Why have real yields risen in 2026?
On the data, the ten-year nominal yield rose 82 basis points from 31 December 2025 to 26 October 2026, and 73 of them were real yield. The desk reads that as consistent with tighter policy expectations, Treasury supply and term premium; the split alone cannot prove the cause.
Can real yields be negative?
Yes. The ten-year real yield was below zero from March 2020 to April 2022 and reached minus 1.19 per cent in August 2021, a locked-in loss after inflation.
This explainer is part of the FO Research library. We read the data. We call the paths.

Get the next explainer by email.
Free, no card required. Your email also opens the full FO News Live view with its asset tags, the FO view and market moves on the calendar, the full positioning check and surprise alerts by email.
Join free