Explainer
PCE vs CPI: Two Inflation Gauges and the Wedge Between Them

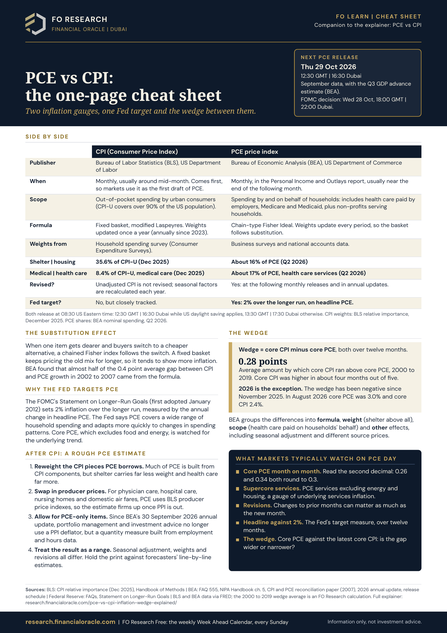
The short answer: PCE vs CPI comes down to scope, weights, formula and price inputs: the Consumer Price Index measures what urban households pay out of pocket, while the personal consumption expenditures price index, the measure behind the Federal Reserve’s 2 per cent target, covers everything consumed by or on behalf of households and lets its basket shift as people substitute. The gap between their core rates, the wedge, usually leaves core CPI a few tenths above core PCE, but in August 2026 core PCE ran at 3.0 per cent and core CPI at 2.4 per cent, the reverse of the usual pattern.
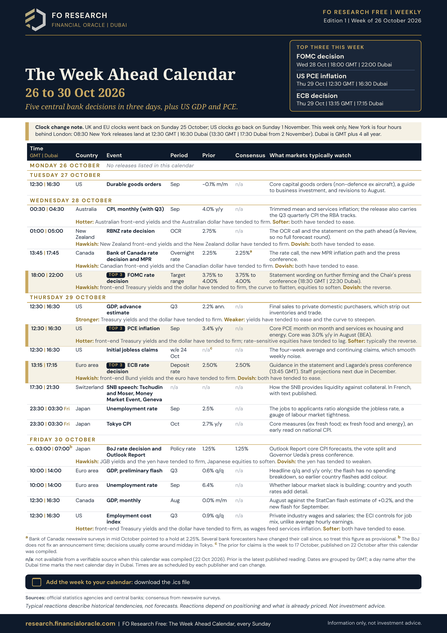
The Bureau of Economic Analysis publishes the September PCE figures at 12:30 GMT (16:30 Dubai) on Thursday 29 October 2026, alongside the advance estimate of third-quarter GDP. The Federal Reserve announces its decision the day before, at 18:00 GMT (22:00 Dubai) on Wednesday 28 October, so the committee meets with September CPI and producer prices in hand but not the measure it targets.
What CPI and PCE each measure
| CPI and PCE side by side | ||
| CPI | PCE price index | |
| Publisher | Bureau of Labor Statistics | Bureau of Economic Analysis |
| Whose spending | Urban households, out of pocket | All households, plus spending on their behalf by employers, government and non-profits |
| Weights from | Household spending survey, updated yearly | Business and national accounts data, updated every period |
| Shelter or housing | 35.6% of the index | About 16% of spending |
| Medical care | 8.4% of the index | 17.3% of spending |
| Revised? | Unadjusted data, no | Yes, monthly and annually |
| Fed target? | No | Yes, 2 per cent on headline PCE |
| CPI weights: BLS relative importance, December 2025. PCE shares: BEA nominal spending, August 2026. | ||
Scope. CPI, from the Bureau of Labor Statistics, covers spending that urban households make themselves. PCE, from the Bureau of Economic Analysis, covers all consumption by households plus spending made on their behalf: health care paid by employers, Medicare and Medicaid, and services from non-profit institutions. The biggest consequence: medical care is 8.4 per cent of CPI but 17.3 per cent of PCE.
Weights. CPI weights come from a household spending survey; PCE weights come from business and national accounts data. The biggest difference is housing. Shelter, mostly the rent homeowners are assumed to pay themselves, is 35.6 per cent of CPI and about 45 per cent of core CPI. Housing is about 16 per cent of PCE and 18 per cent of core PCE.
Formula. CPI prices a basket whose weights are updated once a year. PCE uses a chain-type formula that updates weights every period, so when one category gets dearer and buyers switch to another, the index follows. This substitution effect is one reason PCE has tended to run lower over long periods.
Revisions. Unadjusted CPI is not revised once published. PCE is revised: at the following monthly releases and each year in an annual update. The annual update of 30 September 2026 revised core PCE back to 2021 and lowered July 2026 from 3.3 to 3.0 per cent over the year.
How the wedge works
The wedge is core CPI inflation minus core PCE inflation, both over twelve months. For CPI and PCE more broadly, the Bureau of Economic Analysis groups the differences into weight, scope and formula effects plus “other effects”, including seasonal adjustment and differences in source prices. For some services, including physician care, hospital care and domestic air fares, PCE uses producer prices rather than the matching consumer price series. Since the 30 September annual update, portfolio management and investment advice has instead used nominal spending and a quantity measure built from employment and hours in the industry.
From 2000 to 2019 core CPI ran on average 0.28 percentage points above core PCE, and above it in four months out of five. 2026 has broken that habit.

In January 2024 the wedge was 0.64 points: core CPI 3.9 per cent, core PCE 3.2 per cent. Shelter was a large part of that: rising 6.0 per cent a year in CPI, on nearly half of core CPI but less than a fifth of core PCE. By August 2026 CPI shelter had cooled to 3.0 per cent, so that weight effect shrank.
Other differences then showed through. CPI medical care rose only 1.6 per cent in the year to August, held down by a health insurance index, measured indirectly from insurers’ retained earnings, that fell 8.5 per cent. PCE health care prices, built largely from producer prices that reflect what insurers and government pay, rose 3.2 per cent. As an illustration, not an official contribution or a decomposition of the wedge, weight times rate puts health care at about 0.6 of a point of core PCE and medical care at about 0.2 of core CPI. PCE prices for portfolio management, almost 2 per cent of core PCE, were 8.6 per cent higher on the year; CPI has almost no equivalent.
Shelter’s shrinking contribution appears to have exposed these differences; exact shares would need a component-level reconciliation. The wedge has been negative since November 2025, and at minus 0.56 points in August 2026 it was the widest in that direction since 2010.
Why it matters now
The Federal Reserve’s 2 per cent target is set on headline PCE; policymakers watch core PCE, which excludes food and energy, for the underlying trend. In August both headline measures rounded to 3.4 per cent, but core PCE was 0.6 points above core CPI. Read core CPI alone and underlying inflation looks closer to target than it is on the Fed’s measure.
May shows how wide the gap can get. Core PCE was first published at 3.4 per cent, above a soft core CPI. Revised, May core PCE is 3.2 per cent against core CPI of 2.9 per cent: a narrower gap, in the same direction.
September sets up the same test. CPI rose 0.6 per cent on the month and 3.7 on the year, core 0.3 and 2.6, as the Brief The Print Was Hot. The Tape Sold It. scored. A day later final demand producer prices rose 1.3 per cent against 0.6 expected, as the desk’s live alert recorded. The lines that feed PCE were mixed. Airline passenger services rose 5.0 per cent on the month, seasonally adjusted. Domestic airline passenger services, the PCE source series, rose 4.6 per cent before seasonal adjustment. CPI airline fares rose 1.2 per cent on a seasonally adjusted basis. Physician and hospital care rose 0.3 per cent or less. Portfolio management’s producer price, up 21.2 per cent on the year, is now context, not an input.
Air transportation is a little over 1 per cent of core PCE, so a rise of about 5 per cent, if it fed through in full, would add roughly five to six hundredths of a point to the month’s core PCE. Forecasters’ line-by-line estimates are the figures to hold the print against on Thursday.
How the desk uses it
The desk reads CPI as a first draft of PCE and registers in advance what a print would change. On 25 August the Brief Three Hands. One Pen. registered that an in-line July core PCE would change nothing, because the desk’s dated inflation test was the 11 September CPI. July printed 0.2 per cent on the month and 3.3 on the year, in line, and the entry is marked held on the desk’s call record at /calls. The record scores what printed on the day, by the method in How the Desk Scores Its Calls; the annual update later revised July to 3.0 per cent.
On 29 October, four checks:
- Core PCE month on month against forecasts. Read the second decimal, as with CPI: 0.26 and 0.34 both round to 0.3.
- The wedge against September core CPI of 2.6 per cent. Is core PCE still above it, and by more or less than August’s 0.56 points?
- Health care and air fares. A major scope difference, and a sharply rising producer price input for September.
- Revisions to August. PCE is revised; a changed prior month can matter as much as the new one.
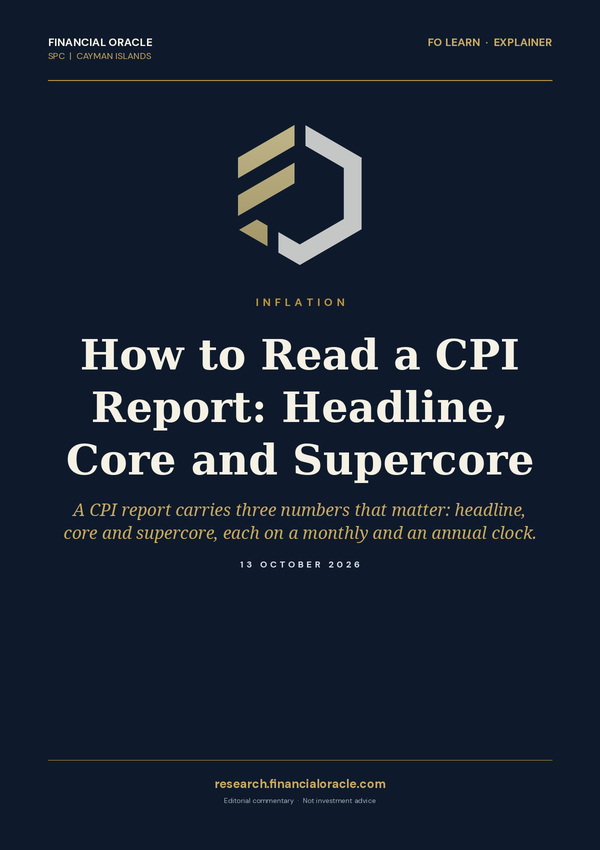
Next in the curriculum: How to Read a CPI Report: Headline, Core and Supercore for the first draft, and The Neutral Rate (r-star) for what the Fed does with the answer.
Frequently asked questions
What is the difference between PCE and CPI?
CPI measures prices of what urban households buy out of pocket. The PCE price index covers all consumer spending, including medical care paid by employers and government, carries much less housing, draws some prices from producer data, and updates its basket every period to allow for substitution.
Why does the Federal Reserve target PCE instead of CPI?
The Fed sets its 2 per cent goal on headline PCE, largely, it says, because PCE covers a wide range of household spending. PCE also allows for substitution and is revised as better data arrive. Policymakers watch core PCE for the trend. CPI comes first, so markets use it to estimate PCE.
Is PCE inflation usually lower than CPI?
Usually. From 2000 to 2019 core CPI averaged 0.28 percentage points above core PCE. Since November 2025 the order has reversed: in August 2026 core PCE was 3.0 per cent, core CPI 2.4.
Why is core PCE higher than core CPI in 2026?
Shelter, heavy in CPI, has cooled to about 3 per cent, which appears to have exposed other differences. Medical care, twice as heavy in PCE, is up 3.2 per cent there but 1.6 per cent in CPI. PCE portfolio management prices, which CPI barely covers, are up 8.6 per cent.
When is PCE released?
PCE comes in the monthly Personal Income and Outlays report, usually near the end of the following month. September 2026 data are due on Thursday 29 October at 12:30 GMT (16:30 Dubai).
This explainer is part of the FO Research library. We read the data. We call the paths.

Get the next explainer by email.
Free, no card required. Your email also opens the full FO News Live view with its asset tags, the FO view and market moves on the calendar, the full positioning check and surprise alerts by email.
Join free