Explainer
What Is a Credit Spread? HY OAS Explained
A credit spread is the extra yield a borrower pays over what the government pays for the same maturity. It is the price of being lent to rather than the state. High-yield OAS, usually written HY OAS, is that number for the below-investment-grade corporate bond market, where borrowers carry materially greater credit risk than investment-grade issuers, and on 25 September 2026 it stood at 2.93 percentage points (ICE BofA US High Yield Index option-adjusted spread via FRED). The ten-year Treasury it is measured against was yielding above 5 per cent on the same day. So a lender to the companies with the least margin for error was being paid under three points more than a lender to the government.
That single number is the cleanest available reading of whether a rates problem has become an economy problem. It is also the number this desk has published a line on all year, which is the part most explainers leave out.
| The arithmetic, once |
| Suppose the US government can borrow for ten years at 5.18 per cent, which is where the ten-year Treasury closed on 24 September 2026. A below-investment-grade company borrowing for the same ten years has to pay more, because it might not repay. If the market demands 2.93 points of compensation for that risk, the company pays roughly 8.11 per cent. The 2.93 is the credit spread. The 5.18 is what the lender could have earned risk-free instead. Now the useful part. If the spread widens to 3.50 while the Treasury stays put, the company's borrowing cost goes to 8.68 per cent and the bonds that already exist fall in price to get there. Nothing about the government changed. Something about the willingness to lend to companies did, and that is exactly the information the spread is built to isolate. |
One convention before going further, because it trips people up. Spreads are quoted either in percentage points or in basis points, where one basis point is a hundredth of a point. A spread of 2.93 per cent is the same as 293 basis points, and a move from 2.80 to 2.93 is thirteen basis points. Desks say “thirteen wider”. And because bond prices move inversely to yields, a spread that widens means the bonds fell in price: widening is a loss for whoever already owns them, which is why it is watched so closely.
What the spread actually measures
Three things sit inside a credit spread and it is worth separating them, because they move for different reasons.
The first is expected default loss: the chance the borrower does not repay, multiplied by what a lender recovers if they do not. The second is liquidity: the discount for owning something that is harder to sell in size on a bad day. The third is the risk premium, the compensation a lender demands for bearing the uncertainty at all, over and above the arithmetic of the first two. Most of the movement in a spread on any given week is the third one. Default expectations change slowly. Appetite changes quickly.
The OAS part matters more than it sounds. Option-adjusted spread strips out the value of options embedded in the bonds themselves, principally the issuer’s right to call the bond early. High-yield issuers call their debt often, and a callable bond looks artificially cheap on a raw spread measure. Adjusting for the option means the number is comparable with itself across time, which is the whole point of a gauge. When the desk quotes high-yield OAS at 2.93 against 2.60 a month earlier, the comparison is clean.
There is one more reason spreads move that catches readers out, and it has nothing to do with the borrower. When government yields themselves rise sharply, a lender can suddenly earn more for taking no credit risk at all, and the reason those yields are rising is itself worth separating, which is what term premium measures. Corporate bonds have to compete with that, so the spread can widen simply because the risk-free alternative got better. This is why a spread widening during a government bond sell-off needs care: part of it may be the company, and part of it is the Treasury.
The last thing to hold onto is the most important. A spread is a price, not a forecast. It does not predict a default rate. It records what the marginal lender demanded this morning to keep holding the paper. That is why it can be read in real time, and why it is more useful than a survey.
Why the desk calls it the cleanest cross-check
Equities are an ambiguous signal. An index can rise on multiple expansion, on a handful of large names, on flows with no view attached. It can fall on positioning. Reading the economy through an equity index means untangling all of that first.
Credit does not have that problem, and the reason is asymmetry. A lender’s best outcome is being repaid at par: the coupon is the upside and there is no more of it. The downside is the principal. A bond therefore prices the probability of things going wrong almost purely, with no growth story on the other side to muddy the reading. When the people whose only job is to be repaid start asking for more, they are telling you something narrow and specific.
That makes the spread the discriminator between two very different worlds that look identical on a screen of rising yields.
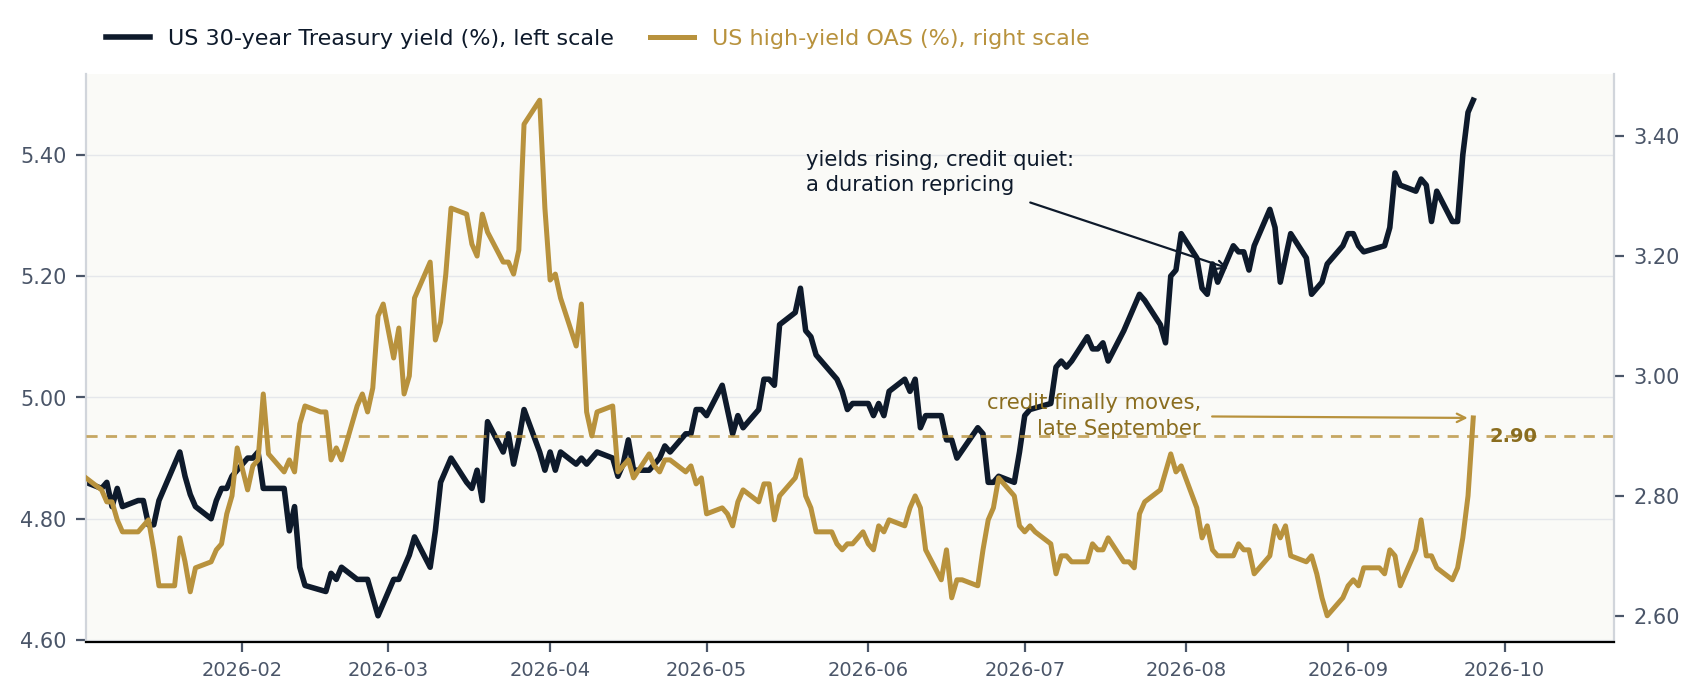
When long government yields rise and credit stays quiet, the market is repricing duration: bond supply, term premium, the compensation for lending long. Which end of the curve moved tells you more again, and the four names for that are worth having. Borrowing costs are going up for the government and for mortgages, but the companies that employ people are still being financed on roughly the terms they were.
When long yields rise and credit widens with them, financing conditions are tightening in the real economy as well as the bond market. The same move has changed category. That is the difference between a duration repricing and a move that is beginning to threaten the growth outlook, and the spread is where it shows up first.
One refinement the desk applies to every reading: the manner of the widening carries as much information as the size. A drift wider through bad news is a tax being levied slowly on leveraged borrowers, and it is survivable. A gap wider, several tenths in days with no new information, is a repricing of solvency and it behaves differently. Drift is a cost. A gap is a decision.
The levels, and why the desk publishes one
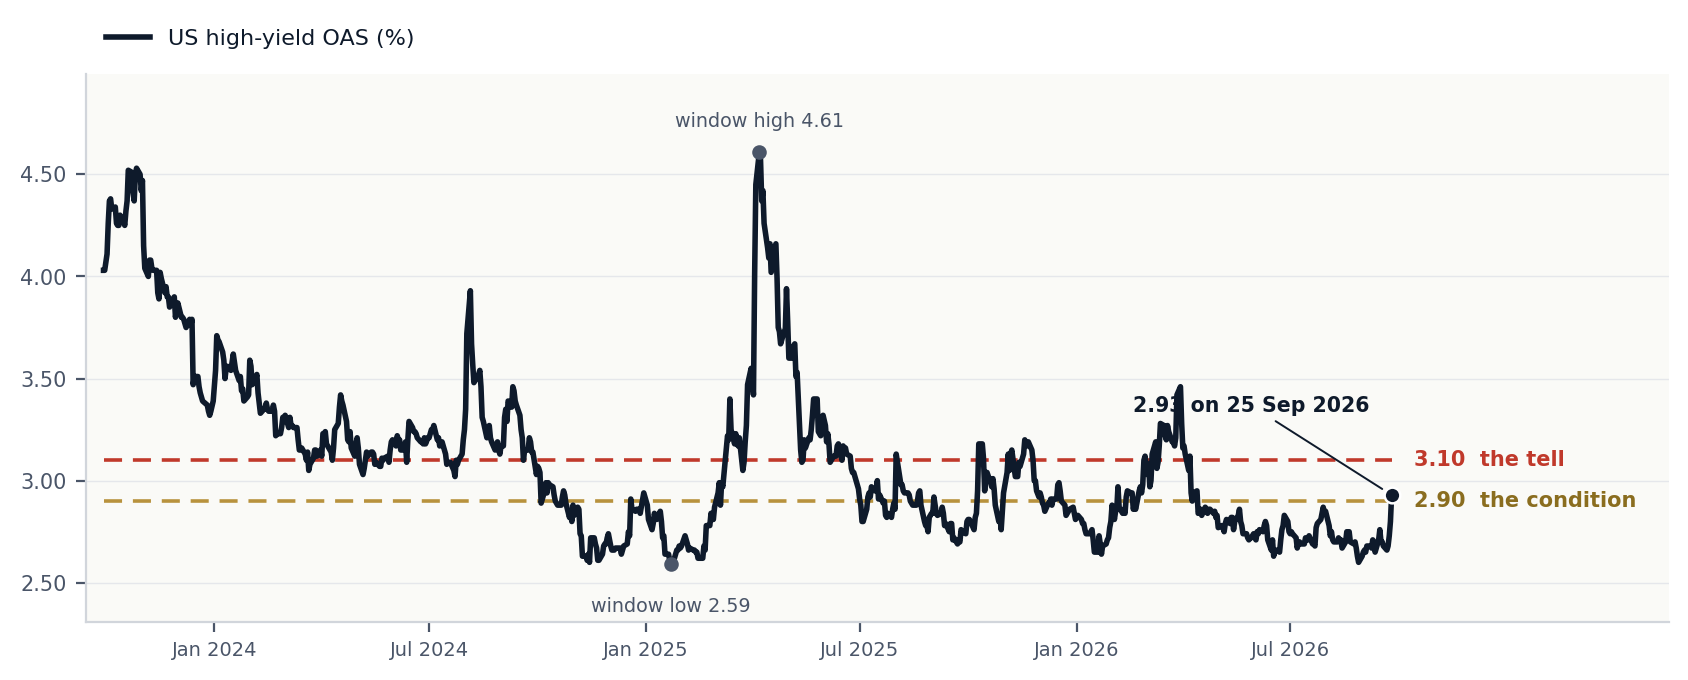
Context first, and stated against the window the desk can verify from source. Across the three years to 25 September 2026, high-yield OAS ranged from a low of 2.59 in January 2025 to a high of 4.61 in April 2025. Inside 2026 alone the range has been 2.60, set on 28 August, to 3.46 in March.
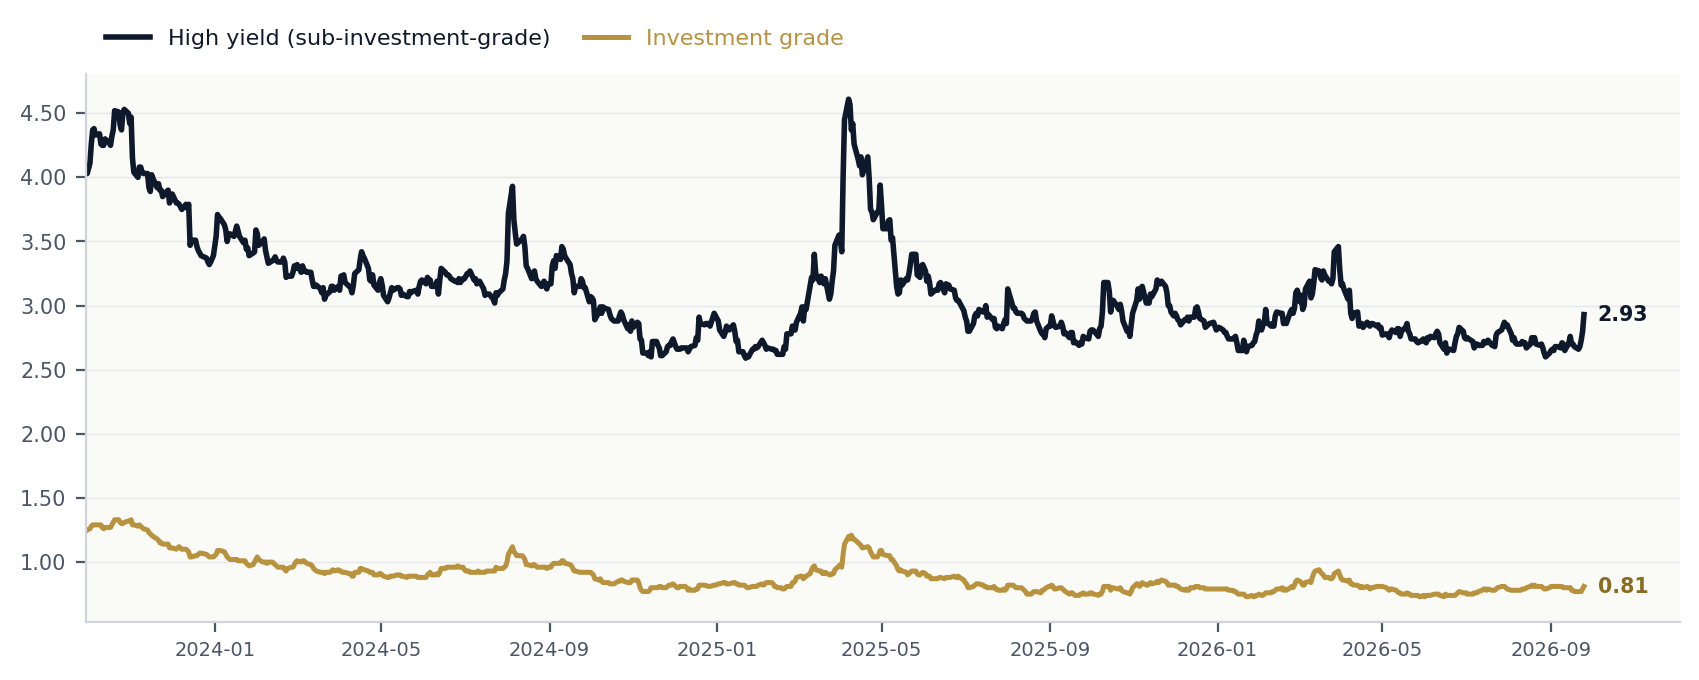
For scale, investment-grade OAS on the same 25 September was 0.81 (ICE BofA US Corporate Index via FRED). High yield was trading at 3.6 times investment grade. That ratio is itself a stress gauge: when it widens, the market is discriminating between strong and weak borrowers rather than repricing credit as a whole.
Against that, this desk publishes two specific lines and has done all year.
2.90 is a condition. It is the level below which the desk’s published growth scenario stays at its standing weight. 3.10 and widening is the tell: the single development that moves the desk to the growth path on its own, without needing a second confirmation from anywhere else.
| The three states, as the desk reads them | |
| Below 2.90 | Rates and duration stress dominates. The desk's growth scenario keeps its standing weight and a bond sell-off is read as supply and term premium. |
| 2.90 to 3.10 | The condition has been crossed. Credit is beginning to validate tighter financial conditions, but it is not yet enough on its own to change the map. This is where the spread sits at 2.93 on 25 September 2026. |
| Above 3.10, widening | The tell. The desk treats the sell-off as a growth problem rather than a Treasury duration problem, and reweights on this signal alone. |
Publishing a level is uncomfortable and that is the point, and it is the same discipline the desk applies to scoring every call it makes. A framework that says “watch credit” cannot be wrong. A framework that says “3.10 and widening reweights the map” can be, in public, on a date. The desk publishes the number so the reader can hold it to the number.
How the desk uses it
Through the whole of the 2026 energy shock, credit declined to confirm anything. It sat near its tights through a war, a labour scare, the worst retail sales print in over a year, a record diesel price and a thirty-year yield at levels not seen in two decades. That refusal is precisely what allowed the desk to carry its floor thesis as a rates story rather than a growth one. Every time a soft data point arrived, the desk checked credit, found it quiet and did not reweight.
Then in late September it moved. High-yield OAS went from 2.60 on 28 August to 2.93 on 25 September, crossing the 2.90 condition for the first time in the cycle. That is not the tell, which sits seventeen basis points higher, and four sessions is not a signature. But a registered condition of the desk’s own framework had been crossed, and the note that went out on 29 September said so rather than waiting to be asked.
That is the whole use of the gauge. Not prediction. A standing check, with the levels published in advance, that decides which of two stories the tape is telling.
Frequently asked questions
What is a credit spread?
The extra yield a borrower pays over a government bond of the same maturity. It compensates the lender for expected default losses, for lower liquidity and for bearing the risk at all. Quoted in basis points or percentage points.
What does OAS mean?
Option-adjusted spread. It removes the value of options embedded in the bonds, mainly the issuer’s right to redeem early, so the spread can be compared with itself over time rather than moving because the call option changed value.
What is a normal high-yield spread?
There is no single normal, which is why the desk quotes a range rather than an average. Across the three years to 25 September 2026 the US high-yield OAS moved between 2.59 and 4.61 percentage points. Below roughly 3 the market is pricing very little corporate stress; above 4 it is pricing a visible amount.
Why do credit spreads widen?
Because the marginal lender wants more to keep holding the paper. That can be rising default expectations, but more often it is a fall in appetite: worse liquidity, a crowded position being reduced, or a competing asset offering more. When government yields themselves are rising sharply, spreads can widen simply because lenders can get paid more elsewhere for less risk.
What is the difference between high-yield and investment-grade spreads?
Investment grade covers borrowers rated BBB minus or Baa3 and above, depending on the agency, and high yield everything below. High-yield spreads are several times wider and far more responsive, which is why the desk watches high yield for the signal and investment grade for confirmation that stress is broadening rather than concentrated.
Do credit spreads predict recessions?
They do not predict, they price. Spreads widen when lending conditions tighten, and tightening lending conditions are part of how downturns happen rather than a forecast of one. The useful discipline is to treat a widening as evidence that the cost of credit is now doing damage, and to ask what else confirms it.
| Free macro explainers, delivered in fullNew explainers reach the free list in full as they publish, with every research note's teaser alongside. Join the free list · inspect the scored record at /calls · the newest scored note is Twelve to Nothing. The Curve Went Further. |
This explainer is part of the FO Research library. The desk publishes its market reads before the print, dates them, and scores them against the tape afterwards. We read the data. We call the paths.

The research is Premium. The record is public.
Every Brief and Analysis in full: the scenario maps with explicit invalidation, the cross-asset tactical reads, the desk-formatted PDFs, and a scorecard where every call is dated before the print and scored after it, misses included. Inspect the record before you pay for it.
Subscribe to Premium →Not ready? Get the teasers by email, free · New to the mechanics? Learn is open to everyone.