Explainer
The Crack Spread and the Next CPI Print
The crack spread is the refining margin: the difference between what a refinery pays for crude oil and what it earns selling the gasoline and diesel it makes from it. The standard gauge is the 3-2-1 crack, which prices three barrels of crude against two barrels of gasoline and one of diesel, roughly the product mix of a typical refinery. It matters because consumers never buy crude. They buy products, and the margin between the barrel and the pump is where an oil shock either becomes inflation or quietly dies. In 2026 that margin, not the oil price, has been the desk's best early gauge of where US consumer prices were heading, and in late August it set the widest reading the desk's series has ever measured.
What the number actually is
Take the futures price of gasoline and diesel, convert from gallons to barrels, weight them two to one, and subtract the cost of three barrels of crude. The result, quoted in dollars per barrel, is what the market is paying refiners to turn crude into usable fuel. When products are scarce relative to crude, the crack widens and refining is lucrative. When crude is expensive relative to what the products fetch, the crack narrows and refining economics deteriorate. The desk computes its own continuous 3-2-1 series from exchange settles, on a WTI basis, rolling contracts on a fixed rule so that a change in the front month is never mistaken for a change in price.
The essential property is that the crack can move without the barrel moving, and against it. Crude can fall while gasoline rises, widening the margin: exactly what happened for long stretches of 2026. A reader watching only the oil price would have concluded the energy shock was fading. A reader watching the crack knew the opposite, because the price that reaches households was still climbing.
Why the margin, not the barrel, becomes inflation
The transmission chain into consumer prices runs in one direction: crude to wholesale product, wholesale product to pump, pump into the energy lines of the inflation indices, with each link lagging the one before it by days to weeks. Pump prices follow wholesale product with a lag of roughly one to two weeks; the inflation indices sample pump prices through the month. So the crack is upstream of the CPI's energy components by roughly a month, which is what makes it a forecasting instrument rather than a coincident one. A widening, product-led crack today is an early signal of pressure on an upcoming headline inflation print, before that pressure is fully visible in the official data.
The discipline is in the decomposition, because a wide margin is not automatically a consumer fuel shock. The crack widens for two very different reasons: products rising, which reaches the pump, or crude falling, which flatters the margin without raising anyone's bill. When the desk's series first broke its old records in July 2026, more than half the move was crude falling rather than fuel rising, and the desk said so at the time, because a record that flatters the thesis is exactly the reading to distrust. The transmission case strengthens when the products themselves lead, when refinery utilisation runs near its ceiling and when inventories of the products are thin. All three conditions held in late August 2026: the margin was product-led, with US distillate stocks at their lowest on record for the date and diesel margins at records (EIA data via press, 1 September 2026).
The 2026 case study
The desk's series tells this year's inflation story more cleanly than the oil price does. The 3-2-1 crack set a record 69.45 on 16 July as the Middle East supply shock moved downstream from the barrel into refining. It printed 72.22 on 28 July, rolled off, then re-widened to 66.72 by mid-August even as crude fell, through the largest US crude inventory build in years, because the constraint was refining capacity, not crude supply. On 28 August it set a fresh record at 75.31, before the weekend the Strait of Hormuz went kinetic, and it printed 73.41 at the next settle, through the exchange of strikes. Meanwhile the national average pump price held above $4 a gallon every day of August, the most expensive August at the pump on record (AP, 31 August 2026).
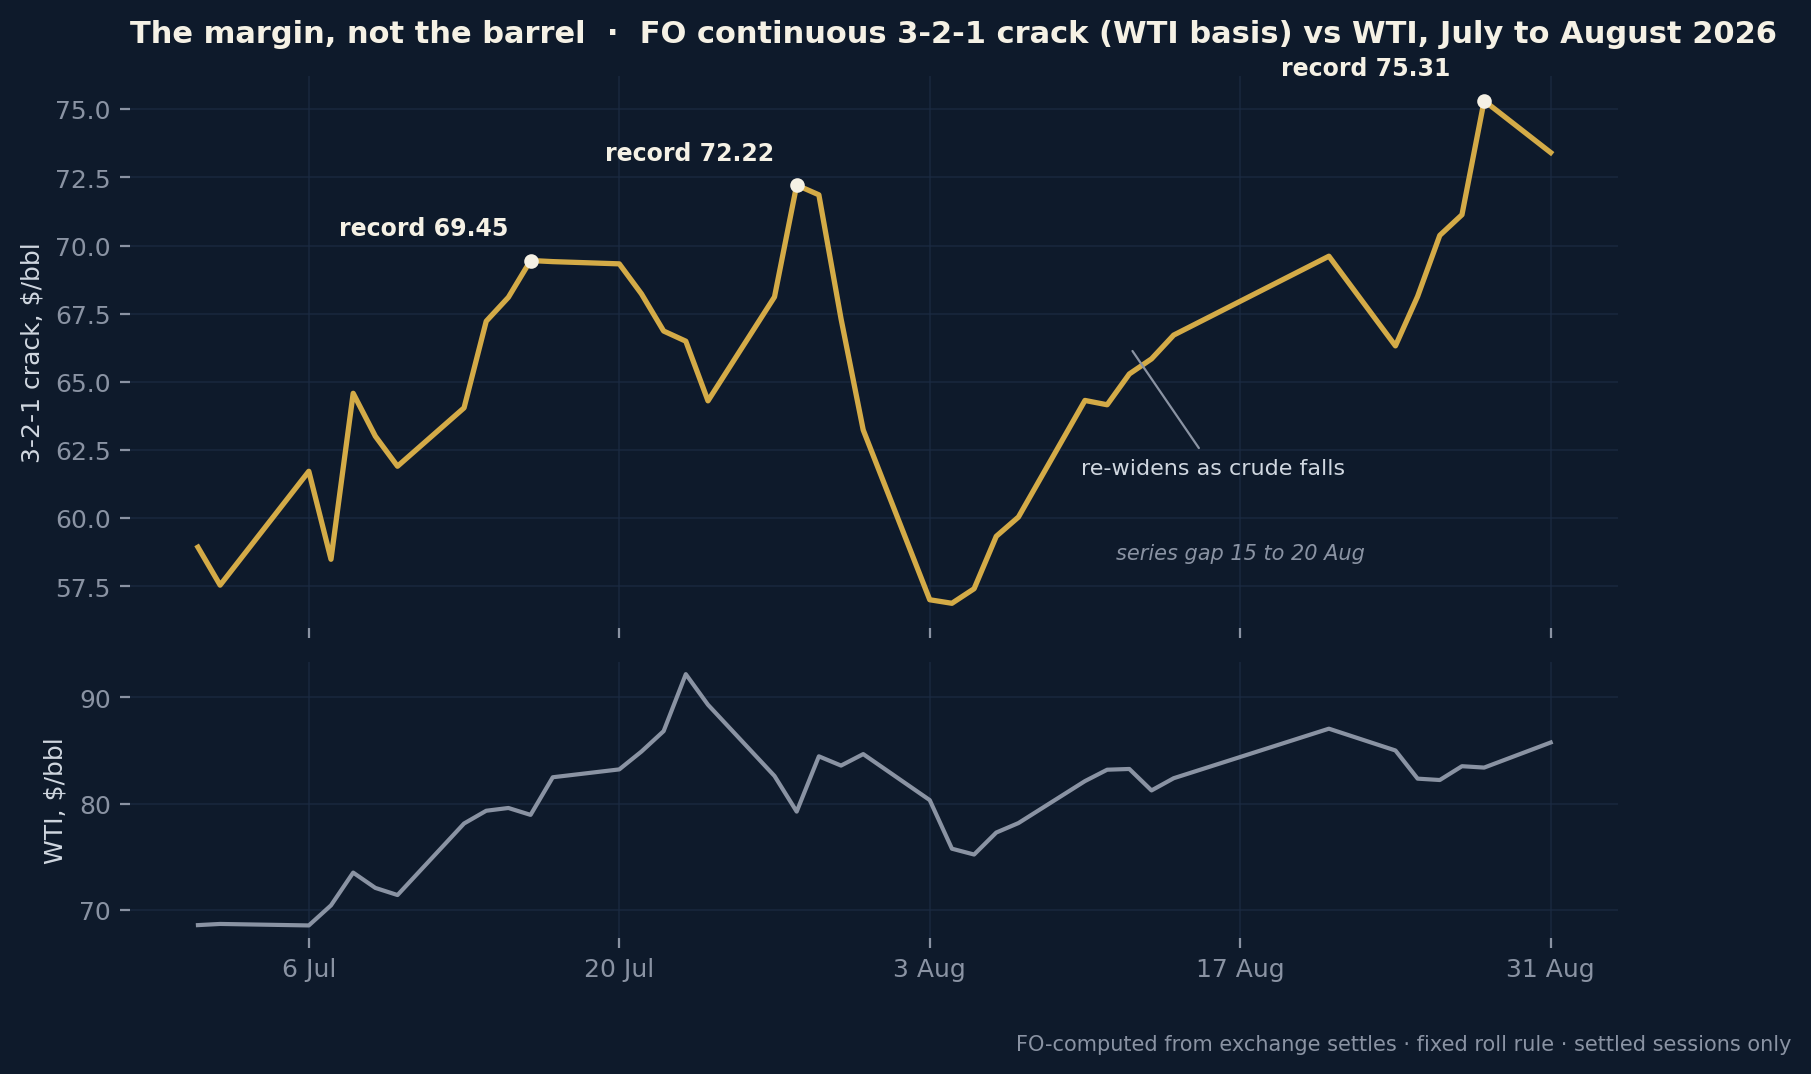
Two lessons sit in that sequence. First, the margin peaked before the geopolitical headlines did: the tightness was in refining all along, and the strait exchange landed on a market already stretched. Second, at the start of September the desk's series rolled its product contracts, resetting the base roughly eleven dollars lower. That is a basis change, not a price move, and the desk marks it as roll: the discriminator from that point is the new strip's direction, not its level against August's. A series that hides its rolls is a series that manufactures signals.
How the desk uses it
The crack is one of the desk's two registered discriminators for any energy shock, alongside credit spreads. The framework, published in The Crack Premium. (21 July 2026), is that the margin decides whether an oil headline becomes an inflation event, and credit decides whether it becomes a growth event. A crude rally with a wide margin and quiet credit extends an inflation problem. A margin collapsing into widening credit is a growth problem wearing an energy costume. When the strait went from warning to exchange over the last weekend of August, the desk did not have to improvise a judgement: the discriminators were already registered, and the scoring followed them in The Shock Writes. The Committee Waits. (1 September 2026), with the margin one settle off its record and credit refusing to be frightened.
The same gauge carries the desk's dated inflation test: the August CPI, landing on 11 September, five days before the Federal Reserve decides, is where a summer of record refining margins meets the official statistics. The crack is how the desk formed that view a month early, in public, where it can be scored.
Frequently asked questions
What is the 3-2-1 crack spread in simple terms?
It is the profit margin for turning crude oil into fuel: the value of two barrels of gasoline plus one of diesel, minus the cost of the three barrels of crude needed to make them. Quoted in dollars per barrel, it is the standard shorthand for refining profitability.
Why is the crack spread a better inflation signal than the oil price?
Because households buy products, not crude. The inflation indices sample pump prices, and pump prices follow wholesale product prices, which are crude plus the margin. When the margin moves, consumer energy prices move even if crude does nothing, and the lag in the chain makes the crack roughly a month ahead of the official inflation data.
What makes crack spreads widen?
Scarce products relative to crude: refinery outages or capacity running at its ceiling, thin product inventories, strong fuel demand or crude falling faster than products. The reason matters as much as the level, which is why the desk decomposes every wide print into its crude leg and its product leg before treating it as an inflation signal.
Does a record crack spread mean gasoline prices will rise?
Not automatically. If the record came from crude falling, the pump can be flat or lower. If it came from products rising with refineries at full utilisation and low inventories, the pump follows within weeks. The honest reading requires knowing which leg moved: in August 2026 it was the products.
How do you calculate a 3-2-1 crack spread?
Multiply the gasoline futures price per gallon by 42 to get a per-barrel figure, do the same for diesel, then compute two times gasoline plus one times diesel minus three times the crude price, and divide by three for the per-barrel margin. Consistency matters more than the arithmetic: use the same contracts, the same units and a fixed roll rule, or the series will signal things that never happened.
| Free macro explainers, delivered in fullNew explainers reach the free list in full as they publish, with every research note's teaser alongside. Join the free list · inspect the scored record at /calls · the newest scored note is The Shock Writes. The Committee Waits. |
This explainer is part of the FO Research library. The desk publishes its market reads before the print, dates them, and scores them against the tape afterwards. We read the data. We call the paths.

The research is Premium. The record is public.
Every Brief and Analysis in full: the scenario maps with explicit invalidation, the cross-asset tactical reads, the desk-formatted PDFs, and a scorecard where every call is dated before the print and scored after it, misses included. Inspect the record before you pay for it.
Subscribe to Premium →Not ready? Get the teasers by email, free · New to the mechanics? Learn is open to everyone.