regime

FO Analysis: The Crack Premium.

July 21, 2026 · 38 min read · Pardip Bansal
FO Analysis: The Crack Premium.

FO Analysis · Energy & The Inflation Pipeline · 21 July 2026

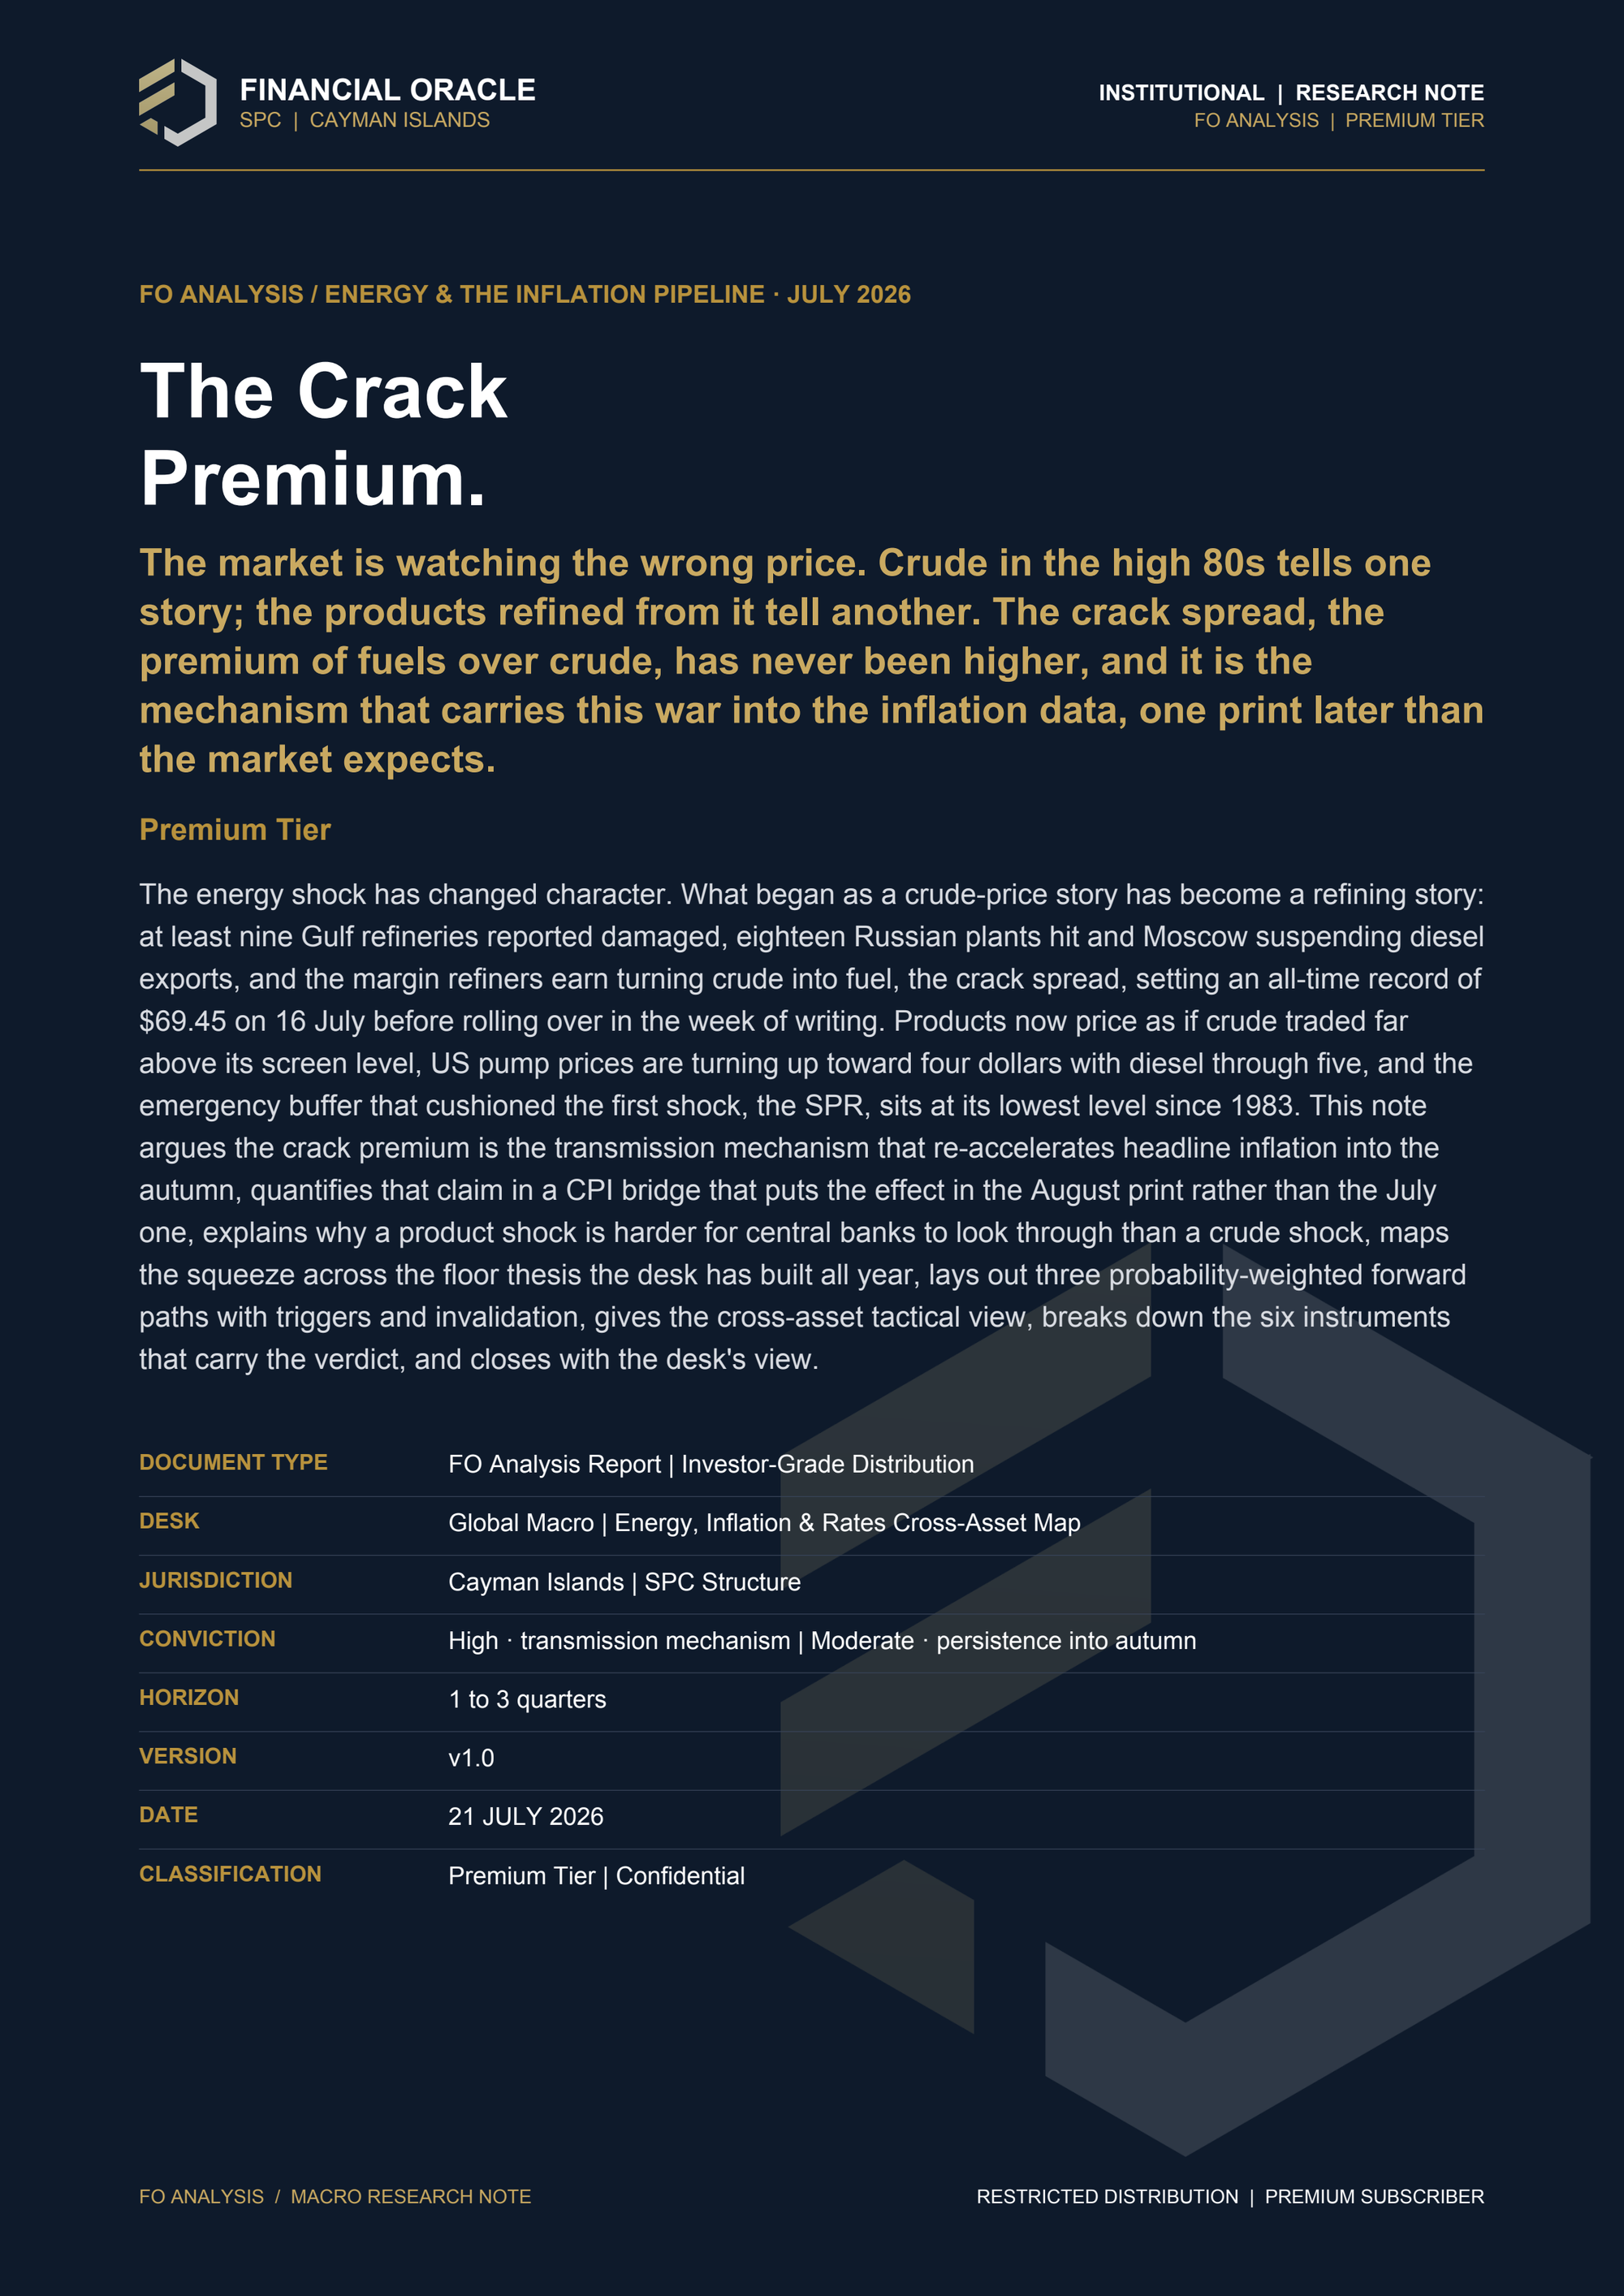
The Crack Premium.

The market is watching the wrong price. Crude in the high 80s tells one story; the products refined from it tell another. The margin between them set a record on 16 July, and it reaches the inflation data one print later than the market expects.

THE VERDICT

The Market Is Watching the Wrong Price.

The market is watching the wrong price. Crude at 89 is the screen number, and it already carries a war premium: the strikes resumed, the strait is blockaded, and Gulf flows are running below half of normal. But the shock has moved downstream of the barrel. With at least nine Gulf refineries damaged, eighteen Russian plants hit and Moscow suspending diesel exports, the constraint is no longer getting crude out of the ground; it is turning crude into fuel. On 16 July the margin for doing so, the 3-2-1 crack spread, settled at $69.45, the highest on record and three and a half times its level at the start of the year. Products are pricing as if crude traded far above its screen level, wholesale gasoline is fifteen per cent off its 1 July low with the pump yet to catch up, and the emergency buffer that cushioned the first leg of this war is at its lowest level since 1983. The crack premium is the mechanism that carries this war into the inflation data, and the floor under long rates is being fed by it. That is the thesis. The honest complication is that the margin stopped rising four sessions ago and, on the unsettled session in which this note is being written, is falling faster than crude. The desk is not going to pretend that away, and it is not going to over-read one partial day either. What follows sets out the mechanism, and then the three things that decide which way it resolves.

The Shorthandcrude is the price on the screen, products are the price the economy pays, and the gap between them set a record on 16 July before rolling over this week. That gap is the transmission, it reaches the consumer with a lag of one to three weeks, and it lands in the August inflation print rather than the July one.
DATA POINTPRINTAS OF / NOTE
3-2-1 crack spread (peak)$69.45 / bbl, record16 Jul 2026 settlement. FO Research computation from front-month NYMEX (CL, RB, HO); construction in the chart source line
3-2-1 crack spread (last settle)$69.33 / bbl20 Jul 2026. Held within $0.12 of the record across three sessions
3-2-1 crack spread (in progress)~$63 / bbl21 Jul 2026, unsettled and on roughly a tenth of normal product volume. Indicative only, not a close
European diesel refining margin> $60 / bbl, recordBloomberg, 16 Jul 2026; European gasoline premium $41, a four-year high
US retail dieselabove $5 / gallon15 Jul 2026
US retail gasoline (national avg)$3.855 / gallon13 Jul 2026 weekly, US EIA via FRED (GASREGW). Down from $4.05 in June and $4.48 in May: retail is still working off the June crude collapse
US retail gasoline (implied)~$4.20 / gallonEquilibrium at the 21 Jul wholesale price, on a 7-day lag and the $1.01 mean retail-to-RBOB spread. The Financial Times reported above $4 on 20 Jul, consistent with this pass-through
Brent crude$88.7821 Jul 2026, indicative intraday snapshot, roughly 23% above the 1 Jun pre-escalation level
Gulf refineries damagedat least nineBahrain, Kuwait, Saudi Arabia among them; wire reporting, mid-Jul 2026
Russian refineries hitat least eighteenMoscow suspending diesel exports; wire reporting, mid-Jul 2026
Strait of Hormuz flowsbelow 50% of pre-warGoldman Sachs note, 15 Jul 2026: recovered above 80%, then fell back, ~11mn bbl/day short
US Strategic Petroleum Reserve316.5mn barrelsS&P Global, 15 Jul 2026: lowest since April 1983 after a 172mn-barrel emergency release
US 30-Year yield5.12%20 Jul 2026 close, the top of the 4.85 to 5.20 band
US 2-Year yield4.21%20 Jul 2026 close, above the 3.75% funds ceiling
US 10-Year breakeven2.25%20 Jul 2026, anchored, the pass-through watch
US HY OAS2.73%17 Jul 2026, stirring off the tights
USD/JPY162.621 Jul 2026 indicative snapshot, the release valve, intervention watch
Gold (spot)~$4,07121 Jul 2026 indicative snapshot, firm

Data timing: the refining, SPR, Hormuz and European margin figures are dated 15 to 20 July 2026 and are cited to their publishers in the sources. The 3-2-1 crack spread is the desk's own computation from front-month NYMEX settlements, complete through the 20 July settle. US yields, the breakeven and credit spreads are the latest official FRED prints, dated individually in the fact box. Retail gasoline is the weekly national average through 13 July. Brent, USD/JPY and gold are indicative reads taken on the morning of 21 July, not official closes. The 21 July session was still in progress at the time of writing, on roughly a tenth of normal product volume, and is marked as such wherever it appears.

The data points above are the data spine of this Premium. Throughout the body the desk labels material as Confirmed (a sourced primary fact), Observed (a live market level), FO inference (the desk's read), or FO risk scenario (a forward path under specific triggers). When in doubt, follow the labels.

main
The 3-2-1 crack spread: the margin from turning three barrels of crude into two of gasoline and one of diesel. This is the note in one frame, and it is the actual series rather than a proxy. It began 2026 at $19.84, settled at a record $69.45 on 16 July, and has since stopped rising. Three and a half times in under seven months, almost all of it since the spring. The dashed tail is the session in progress at the time of writing, which is not a settlement and is drawn so it cannot be read as one.

The chart is the thesis, and it is the actual computed series rather than a proxy. The 3-2-1 crack opened 2026 near $20 and settled at a record $69.45 on 16 July, three and a half times its level in January, with almost the whole move arriving since the spring. It then held within twelve cents across the 17 and 20 July settles and has not made a new high. The dashed tail is the unsettled 21 July session. The record is confirmed; what the note has to establish is whether it persists long enough to reach the consumer, and how much of it was ever a product story at all.

THESIS PERFORMANCE · SCORED AGAINST THE TAPE

What Ratified. What Is Advancing.

A Premium thesis is only as good as its performance record. Subscribers should expect this scorecard in every Premium.

CALLRATIFIEDWHAT HAPPENED
A Pipeline, Not a Spike (13 May, Premium): inflation is a broadening supply-side process, not an energy pop that clears.ADVANCINGThe pipeline now has a physical bottleneck: refining. Supply-side inflation is printing in the margin between crude and fuel.
The War Is Over. The Floor Isn't. (19 Jun, Brief): the peace would not lower the floor, because the floor was never the war.YESThe war came back anyway, and the floor met it at the top of its band rather than the bottom.
The Disinflation Arrives. The Floor Doesn't Break. (15 Jul, Brief): June's soft prints leaned on an energy dip that had already reversed; the relief may prove one print wide.EVOLVEDThe reversal now has a mechanism and a number, but the clock was wrong: the pump lag puts it in the August print, one release later than the desk assumed. The relief will look two prints wide, not one.
The Synchronised Floor (10 Jul, Premium): the floor is a cross-central-bank regime set against a common supply-side pipeline.ADVANCINGThe ECB is rethinking rates on the Hormuz fight. The product squeeze is the common pipeline, made visible at every pump in the developed world.
The Silence Premium (23 Jun, Premium): a constrained Fed with limited room to ease keeps a floor under long rates.ADVANCINGA supply-driven product shock into 4% inflation materially raises the hurdle for cutting rates.

The row that matters most this week is the 15 July Brief. The desk wrote that June's disinflation leaned on an energy dip that had already reversed and might prove one print wide. The mechanism has held and the direction has held, but the timing has not: the pump lag means the effect arrives one release later than the desk assumed, in the August print rather than the July one. That is marked Evolved rather than Advancing, because a thesis that needed its clock corrected has not simply advanced.

The full desk read continues below for Premium subscribers: the Regime Dashboard, the probability-weighted three-path Scenario Map with an explicit thesis invalidation, the CPI bridge quantifying the July and August contributions with reproducible bases, the five sections in full, the FO Tactical View, the Cross-Asset Breakdown, how the desk expresses it, the Trader's Checklist, the glossary, and the Premium PDF.

Continue Reading · FO Research Premium
The rest of this note is for Premium subscribers.
You have read the verdict, the data spine and the scored record. What follows is the part that carries the money: the quantified inflation bridge, the three weighted paths with their invalidation, and the cross-asset map.
The full transmission chain: impaired refining capacity, the record product margin, the pump lag, and why the effect lands in the August inflation print rather than the July one.
The CPI bridge: FO-fitted estimates of the gasoline contribution to headline inflation under each path, with the pump-to-CPI coefficient, the retail-to-wholesale spread, and every month-on-month base stated so the arithmetic can be reproduced.
The decomposition that cuts against the easy version of this story: fifty-four per cent of the record crack came from crude falling, not fuel rising.
Confirmed / Observed / FO Inference / FO Risk Scenario labels throughout, separating sourced facts from interpretation.
The Regime Dashboard: eleven cross-asset signals colour-coded RED / AMBER / GREEN.
The probability-weighted Scenario Map (Path A the squeeze persists, 45% / Path B it resolves, 30% / Path C it breaks demand, 25%) with triggers, invalidation, and a stated condition under which the floor thesis itself is wrong.
The five sections in full: the shock changing character, the spent buffer, the transmission, the cross-asset tape and the regime.
How the Desk Expresses It: the cleanest ways to carry the view, and the credit signal that separates an inflation story from a growth one.
The FO Tactical View matrix: directional reads across crude, refined products, the 30-year, the 2-year, breakevens, HY credit, equities, the dollar and gold, across all three paths.
The Cross-Asset Breakdown: instrument-by-instrument reads on the six instruments that carry the verdict.
The Trader's Checklist: what to watch in order, with the tells that confirm or break each path.
The glossary: plain-language definitions of the crack spread, the 3-2-1, product shock, demand destruction, pass-through, term premium and the floor.
The full Premium PDF, desk-formatted for print and offline reading.
Recently Published · Premium Only
15 July 2026The Disinflation Arrives. The Floor Doesn't Break.June CPI came in soft in every line, the front end rallied, and the thirty-year refused to follow.
10 July 2026The Synchronised Floor.The Fed and the ECB turned hawkish inside seventy-two hours against a common supply-side pipeline.
23 June 2026The Silence Premium.A constrained central bank with limited room to ease keeps a floor under long rates.
Subscribe to FO Premium
Editorial-grade macro research, written for sophisticated readers. Notes land when the data warrants.

Receive every report at the source.

The FO Brief is free. Premium delivers the full archive. Institutional includes analyst Q&A.

Subscribe →