Explainer
Steepeners and Flatteners, Named Properly
A steepener is a move that widens the gap between long-term and short-term bond yields; a flattener narrows it. Add whether yields overall rose or fell and you get the four names every rates desk uses: bull steepener, bear steepener, bull flattener and bear flattener. Bull means yields fell, because bond prices rallied. Bear means yields rose. The vocabulary sounds like jargon until you see what it encodes: which end of the curve moved, and therefore who moved it. That single fact, which end led, is often the most information a bond market prints in a day.
The four moves and what each one says
A bear steepener: long yields rise faster than short ones. The market is repricing inflation risk, bond supply or the compensation for holding long-dated paper, with the long end doing more of the repricing than the policy-sensitive front end. The stagflationary variant, long yields up while growth data softens, is the most uncomfortable configuration in macro, because it tightens conditions for borrowers precisely when the economy is weakening.
A bear flattener: short yields rise faster than long ones. The market is pricing central bank action, hikes arriving sooner or going further, while the long end trusts that the tightening will eventually contain inflation. This is the classic shape of a hawkish repricing.
A bull steepener: short yields fall faster than long ones. The market is pricing cuts, usually because growth is deteriorating, while the long end declines to follow, often because inflation or supply still argues against owning duration. Bull steepening often appears late in the cycle as an inverted curve unwinds and markets begin pricing policy easing; it can therefore accompany the transition toward recession.
A bull flattener: long yields fall faster than short ones. Disinflation, haven demand or a collapse in the compensation for duration risk: the long end rallies toward a future of lower rates while the front waits for the central bank to catch up.
The gauges are spread pairs: 2s10s is the ten-year yield minus the two-year, 2s30s the thirty-year minus the two-year. Quoted in basis points, rising means steepening. The levels matter less than the direction and the leader, because the two ends of the curve answer to different masters: the front end is more sensitive to the expected policy path, and the long end prices inflation, deficits and the supply of safe paper over decades.
Which end led is the message
Two moves can produce the same spread change and mean opposite things. 2s30s widens ten basis points: was that the long end selling off on supply fears, a bear steepener, or the front end rallying on cut hopes, a bull steepener? The spread alone cannot tell you. The ends can. That is why a desk never reads the curve as one number, but as two tenors with separate stories, and asks which one wrote today's move.
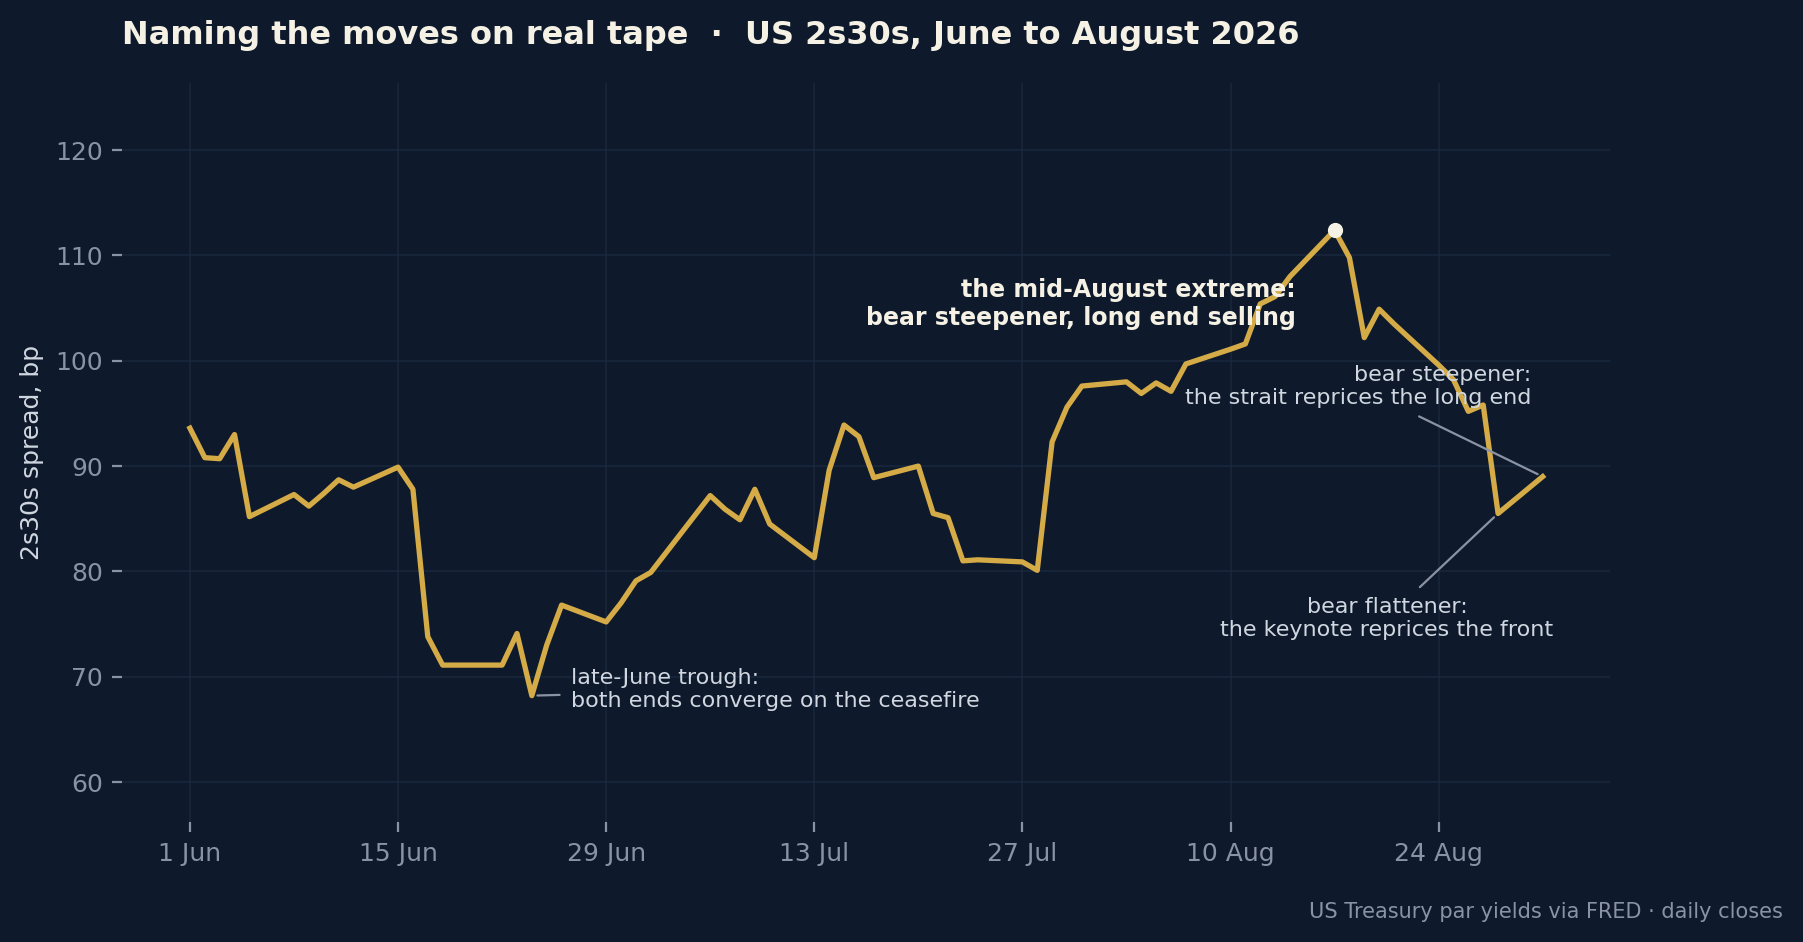
The clearest recent illustration is the last week of August 2026, when the same curve was written by a different hand on each of two consecutive sessions. On the Friday, a hawkish first Jackson Hole address from the new Fed chair moved the two-year up 11.8 basis points while the thirty-year moved 1.5, both on the desk's settle basis: a bear flattener led by the front end, the committee repricing its own meetings and nothing else. On the Monday, a kinetic weekend at the Strait of Hormuz moved the thirty-year up 3.9 basis points while the two-year sat flat: a bear steepener led by the long end, supply risk pricing where duration lives while the committee's tenor waited. Same curve, opposite shapes, and each time the moving end identified the moving force. Earlier that month the same logic ran at larger scale: 2s30s reached 108 basis points on the desk's settle basis, its steepest of the cycle, in a bear steepening driven by a thirty-year selling off through soft growth data, the stagflationary variant, with household inflation expectations rising into weakening retail sales.
How the desk uses the vocabulary
The desk's standing thesis this year, that authority over the price of long money migrated from the Federal Reserve to the curve itself, is at bottom a claim about steepeners and flatteners: that committee communication moves the front end and cannot reach the long end, while supply and inflation move the long end and leave the front alone. Every session that prints one of the four shapes is a test of that claim, which is why the desk's notes name the shape before they argue the meaning. The two sessions above were scored in The Chair Speaks. The Pen Stays. (31 August 2026) and The Shock Writes. The Committee Waits. (1 September 2026), and the cycle-extreme steepening in The High-Water Mark. (18 August 2026). For the layer beneath the vocabulary, the desk's companion pieces explain the yield curve itself and the term premium, the quantity a bear steepener is usually repricing.
Frequently asked questions
What is a bear steepener?
Long-term yields rising faster than short-term yields, widening the curve while bonds sell off. It signals repricing of inflation, bond supply or duration-risk compensation rather than central bank action, and it tightens borrowing conditions without the central bank lifting a finger.
What is the difference between a bull steepener and a bear steepener?
Both widen the gap between long and short yields, but a bull steepener does it with yields falling, led by a front end pricing cuts, while a bear steepener does it with yields rising, led by a long end demanding more compensation. One is a growth-fear shape, the other an inflation-and-supply shape.
What does a bear flattener mean?
Short yields rising faster than long ones: the market bringing forward central bank tightening while the long end stays anchored. It is the standard shape of a hawkish surprise, and it is led by the tenor most directly influenced by the expected central-bank path.
Is a steepening yield curve good or bad for the economy?
It depends entirely on which variant. A bull steepener out of inversion often precedes recessions. A bear steepener raises long-term borrowing costs for mortgages, corporates and the government, and the stagflationary version, long yields up into softening growth, is the configuration policymakers can least afford. The name carries the diagnosis.
What are 2s10s and 2s30s?
Shorthand for the spread between the two-year yield and the ten-year or thirty-year yield, in basis points. They are the standard gauges of curve shape: rising spreads mean steepening, falling spreads mean flattening, and the desk quotes 2s30s when the story is about the longest duration and the deficit that supplies it.
| Free macro explainers, delivered in fullNew explainers reach the free list in full as they publish, with every research note's teaser alongside. Join the free list · inspect the scored record at /calls · the newest scored note is July Never Happened. September Re-Arms. |
This explainer is part of the FO Research library. The desk publishes its market reads before the print, dates them, and scores them against the tape afterwards. We read the data. We call the paths.
The research is Premium. The record is public.
Every Brief and Analysis in full: the scenario maps with explicit invalidation, the cross-asset tactical reads, the desk-formatted PDFs, and a scorecard where every call is dated before the print and scored after it, misses included. Inspect the record before you pay for it.
Subscribe to Premium →Not ready? Get the teasers by email, free · New to the mechanics? Learn is open to everyone.