Explainer
Reading the Yield Curve: Inversion, Un-Inversion and the Timing Trap
The yield curve is the line traced by government-bond yields from short maturities to long. When short yields sit above long yields the curve is inverted, and inversion has preceded most modern US recessions, which is why the market watches it obsessively. The trap is in the timing: historically, the recession has tended to arrive not while the curve is inverted but after it un-inverts. And the latest cycle bent the rule further: the deepest inversion in four decades has passed, so far, without the recession it was supposed to announce. This explainer covers what the curve actually prices, why inversion warns and why the un-inversion is the part most readers get backwards.
What the curve actually prices
A long yield is the market's expected path of short rates plus a term premium, the machinery unpacked in Term Premium, Explained. The curve's shape follows from those two layers. A steep curve says the market expects short rates to rise, or demands a larger premium for bearing duration risk, or both. An inverted curve says policy is tight relative to where rates are expected to settle: the market is pricing cuts ahead. Inversion is not a prophecy engine. It is a statement that the present stance is restrictive against the expected future, which is precisely the condition under which economies have historically slowed.
The common shorthand is the 2s10s: the 10-year yield minus the 2-year. Other pairings, three-month against 10-year most prominently, carry the same logic with different sensitivities.
Why inversion has warned, and how the warning works
Three channels have given the signal its record. Policy: an inverted curve usually exists because the central bank has pushed short rates into restrictive territory, and restrictive policy works with a lag. Credit creation: an inverted curve can compress bank margins and reduce the incentive to extend longer-duration credit, particularly when funding costs are rising. And expectations: the inversion itself is the bond market voting that tightening will eventually force easing. None of these channels operates on a schedule, and the record includes false and delayed signals, which is why the desk treats the curve as one input rather than an oracle.
The un-inversion trap
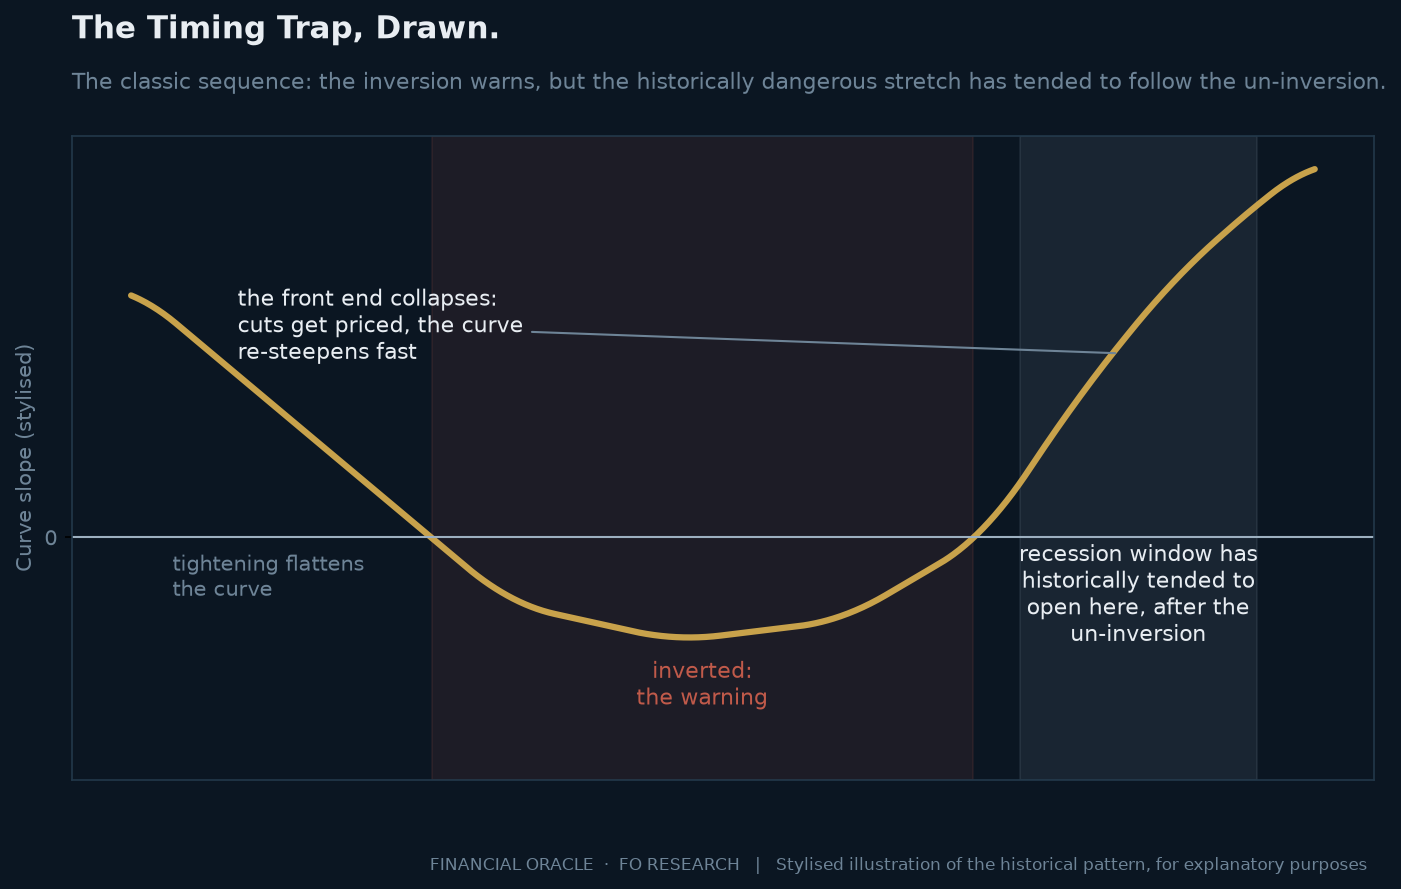
Here is the part that reads backwards. The historically dangerous moment has tended to be not the inversion but the exit from it. Curves have typically re-steepened just before or into recessions, because the front end collapses as the market prices imminent cuts: a bull steepener, in the glossary's language. By the time the curve un-inverts this way, the slowdown that the inversion warned of is often already arriving. Reading the un-inversion as the all-clear is therefore the classic mistake; it has more often been the starting gun.
The composition test is everything. A bull steepener, front end falling fast, has been the pre-recession signature. A bear steepener, long end rising on supply, inflation risk or term premium, is a different animal entirely: it tightens conditions through the long end and says little about imminent recession. Same shape change, opposite meaning. The desk applies the same composition discipline here as everywhere else: the headline moves, the components decide.
What the latest cycle actually did
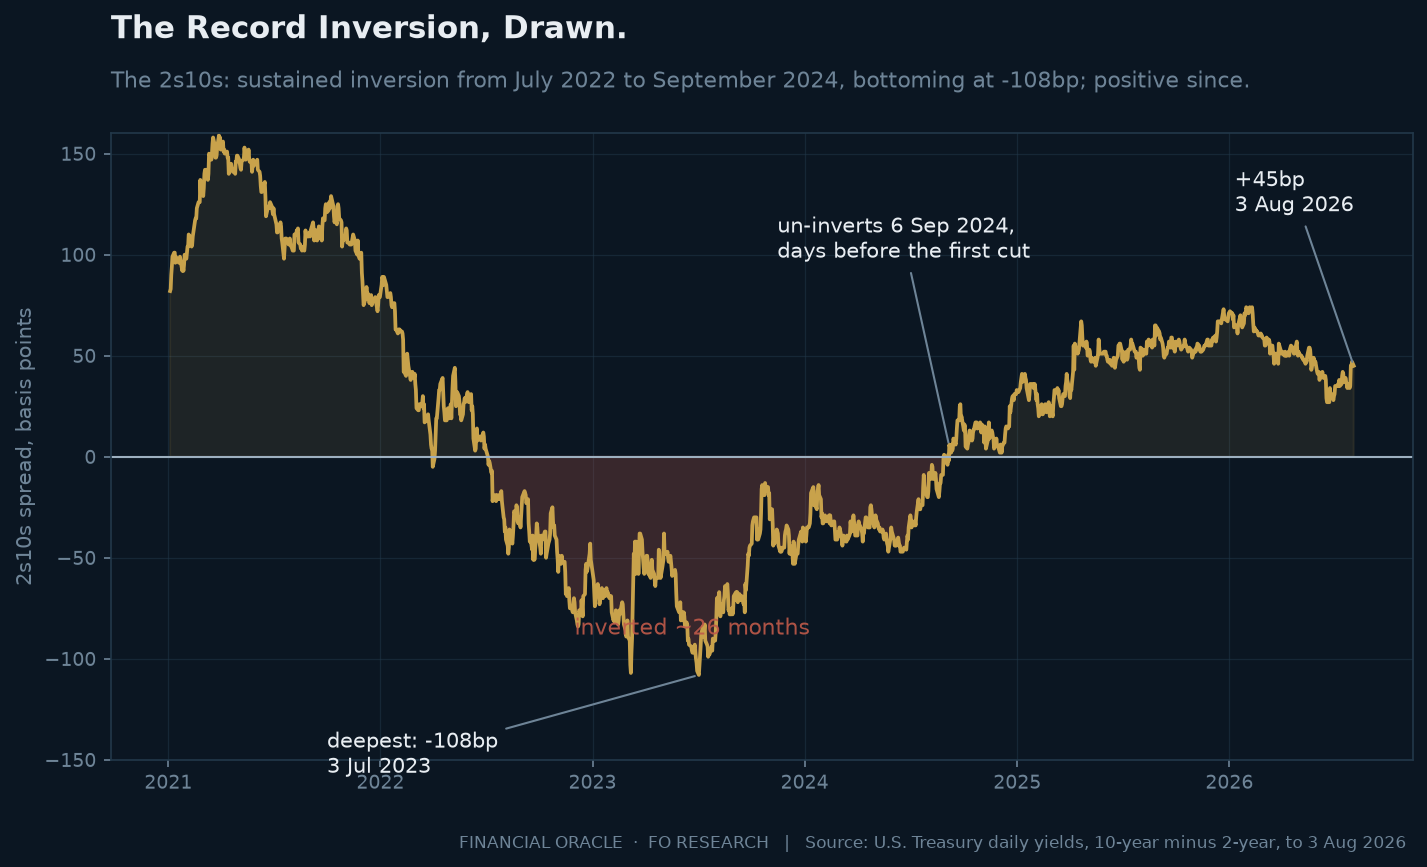
The record cycle is worth stating precisely, because it stressed the signal hard. The 2s10s first inverted briefly in April 2022. The sustained inversion began in July 2022 and ran for about 541 trading days, ending on 6 September 2024, the longest continuous stretch in the modern record. It bottomed at -108 basis points on 3 July 2023, the deepest inversion in four decades. It un-inverted for good on 6 September 2024, days before the Fed's first cut, with the spread at just +9 basis points on the first-cut date.
What followed was not the classic script. Nearly two years on from the un-inversion, no US recession had arrived by mid-2026. And the steepening itself changed character: from the first cut to the sixth the spread widened to +59 basis points largely because the long end rose, the bear dynamics documented in The Long-Bond Disconnect. Through 2026 the spread has oscillated in a positive but historically modest range: as of 4 August 2026 it stood at +43 basis points, with the 2-year at 4.20% against the 10-year at 4.63%. Both ends have been in play, the front end repricing the risk that the next move is a hike rather than a cut, as the desk tracked in The Rebuild Begins, and the long end held up by term premium.
The desk's read is not that the curve is broken. It is that this cycle's curve carried unusual distortions: a structural term-premium repricing, heavy Treasury supply and a thinning buyer base moved the long end for reasons that have nothing to do with recession odds. A signal built on the expectations layer gets noisier when the premium layer is doing the driving. That is an argument for reading the curve through its components, not for discarding it.
Reading it in practice
The desk watches three things alongside the spread itself. The composition of any steepening, because bull and bear steepeners carry opposite messages. Credit, because high-yield spreads are the cleanest cross-check: a curve warning of recession should be confirmed by credit widening, and a curve moving on term premium alone usually is not. And the labour data, because that is where deterioration in the real economy becomes visible and can confirm that the curve's warning is moving beyond market pricing, the thread the desk pulled in The Crack Arrives. A curve signal with credit and labour confirming is a different proposition from a curve signal on its own. The desk's dated curve and rates calls are scored against the tape in the track record.
Frequently asked questions
What is the 2s10s spread?
The 10-year Treasury yield minus the 2-year Treasury yield, the market's standard shorthand for the curve's slope. A positive spread is a normal upward-sloping curve; a negative spread is an inversion.
Does an inverted yield curve always mean a recession is coming?
No. Inversion has preceded most modern US recessions, but the record includes false and delayed signals, and the latest cycle's record-deep inversion had produced no recession nearly two years after it ended. Inversion says policy is restrictive relative to expected future rates; it does not set a date.
Why do recessions tend to start after the curve un-inverts, not during the inversion?
Because the classic un-inversion happens when the front end collapses as markets price imminent cuts, and central banks cut urgently when the economy is already deteriorating. The un-inversion is often the symptom of the downturn arriving, which is why reading it as the all-clear has historically been the trap.
What is the difference between a bull steepener and a bear steepener?
Both steepen the curve. A bull steepener comes from short yields falling fast, typically as cuts are priced, and has been the classic pre-recession signature. A bear steepener comes from long yields rising, on supply, inflation risk or term premium, and carries no such recession message.
What is the yield curve saying now?
As of 4 August 2026 the 2s10s stood at +43 basis points, with the 2-year at 4.20% and the 10-year at 4.63%: a positive curve still shaped by elevated long-end yields and persistent term premium. The desk's dated reads of that configuration live in the research library and are scored in the track record.
This explainer is part of the FO Research library. The desk publishes its market reads before the print, dates them, and scores them against the tape afterwards. We read the data. We call the paths.
The research is Premium. The record is public.
Every Brief and Analysis in full: the scenario maps with explicit invalidation, the cross-asset tactical reads, the desk-formatted PDFs, and a scorecard where every call is dated before the print and scored after it, misses included. Inspect the record before you pay for it.
Subscribe to Premium →Not ready? Get the teasers by email, free · New to the mechanics? Learn is open to everyone.