Explainer
r-star Explained: Is Monetary Policy Actually Tight?
r-star, the neutral rate, is the policy rate that neither stimulates nor restrains the economy once inflation is where the central bank wants it. It is the dividing line between tight and loose. Above it, policy is a brake; below it, an accelerator. The awkward part is that nobody can see it. It is not published, not observed and not stable: it is inferred from models that disagree with each other and revise their own history. That combination, a number that decides everything and can be measured only badly, is why so much of the rates debate is really an argument about r-star without saying so.
Why the nominal policy rate alone tells you very little
A 5% policy rate sounds restrictive. A 2% policy rate sounds accommodative. Neither intuition is complete without a reference point, because what matters is the policy rate relative to two things: inflation, and neutral.
Start with inflation. A useful first-pass gauge is the ex-post real policy rate: the nominal policy rate less realised inflation. It is not the same as the forward-looking real rate that shapes behaviour, which depends on expected inflation, and it is not the borrowing rate faced directly by households or firms. But it gives a clean snapshot of how the stance has shifted. Then compare that proxy with estimates of r-star. If the proxy sits above neutral, policy is more likely to restrain demand. If it sits below, it is more likely to support it. The nominal headline, the number in every news bulletin, is two steps removed from the thing that matters. The desk applies the same discipline here as in Term Premium, Explained: the headline moves, the components decide.
What sets r-star
Neutral is not a policy choice. It is a property of the economy, set by the balance between the desire to save and the desire to invest. Slower productivity growth, an ageing population saving for retirement, and strong global demand for safe assets all push r-star down. Faster productivity growth, heavy public borrowing, and a rising investment cycle push it up. The long decline in estimated neutral rates across advanced economies since the 1980s reflected structural forces: demographics, productivity trends, global saving patterns and demand for safe assets, not a deliberate central-bank choice.
It also means r-star can move. The current cycle has live arguments running in both directions: persistent fiscal deficits and an artificial-intelligence capital-expenditure boom argue for a higher neutral rate, while demographics still argue for a lower one. Any confident claim about where neutral now sits is a claim about which of those forces wins, dressed up as a measurement.
You cannot observe it, only estimate it
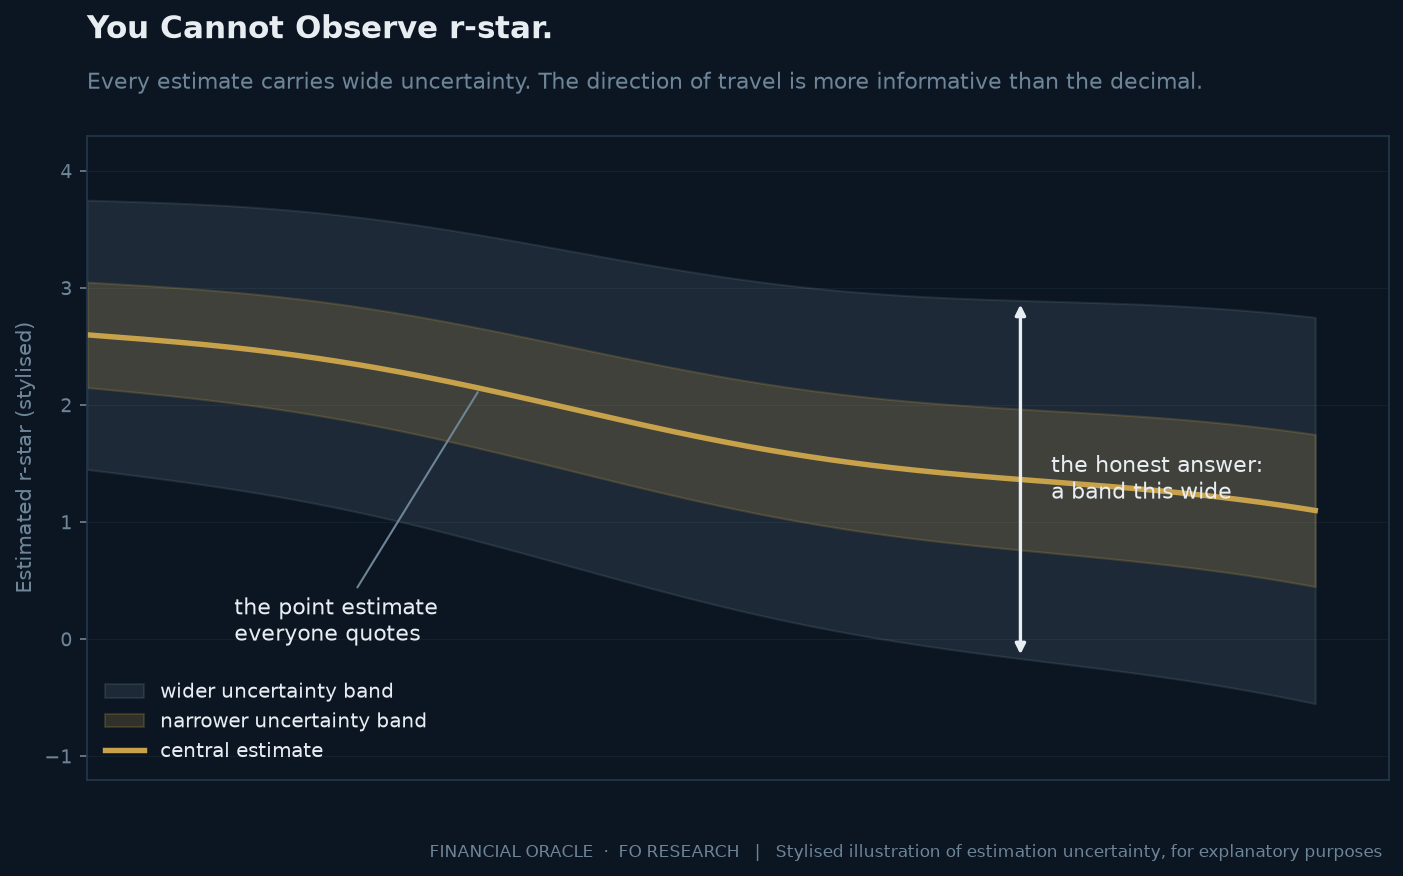
r-star is inferred, most prominently through the Holston-Laubach-Williams framework published by the New York Fed, which backs neutral out of the joint behaviour of growth, inflation and rates. Other approaches read it from market pricing of forward real rates, or from the longer-run dot in the Fed's own projections. They do not agree, they are revised as new data arrives, and their confidence intervals are wide enough to span the difference between tight policy and loose policy.
The desk's practical stance is the same one it takes on term premium: treat the level as soft and the direction as informative. A precise r-star number should be read as an opinion with a decimal point attached. A broad move in estimates, in the same direction, across several methods, is worth acting on.
The test that actually matters now
Set the estimation debate aside and ask the empirical question: where does the real policy rate actually sit today, and how has it moved?
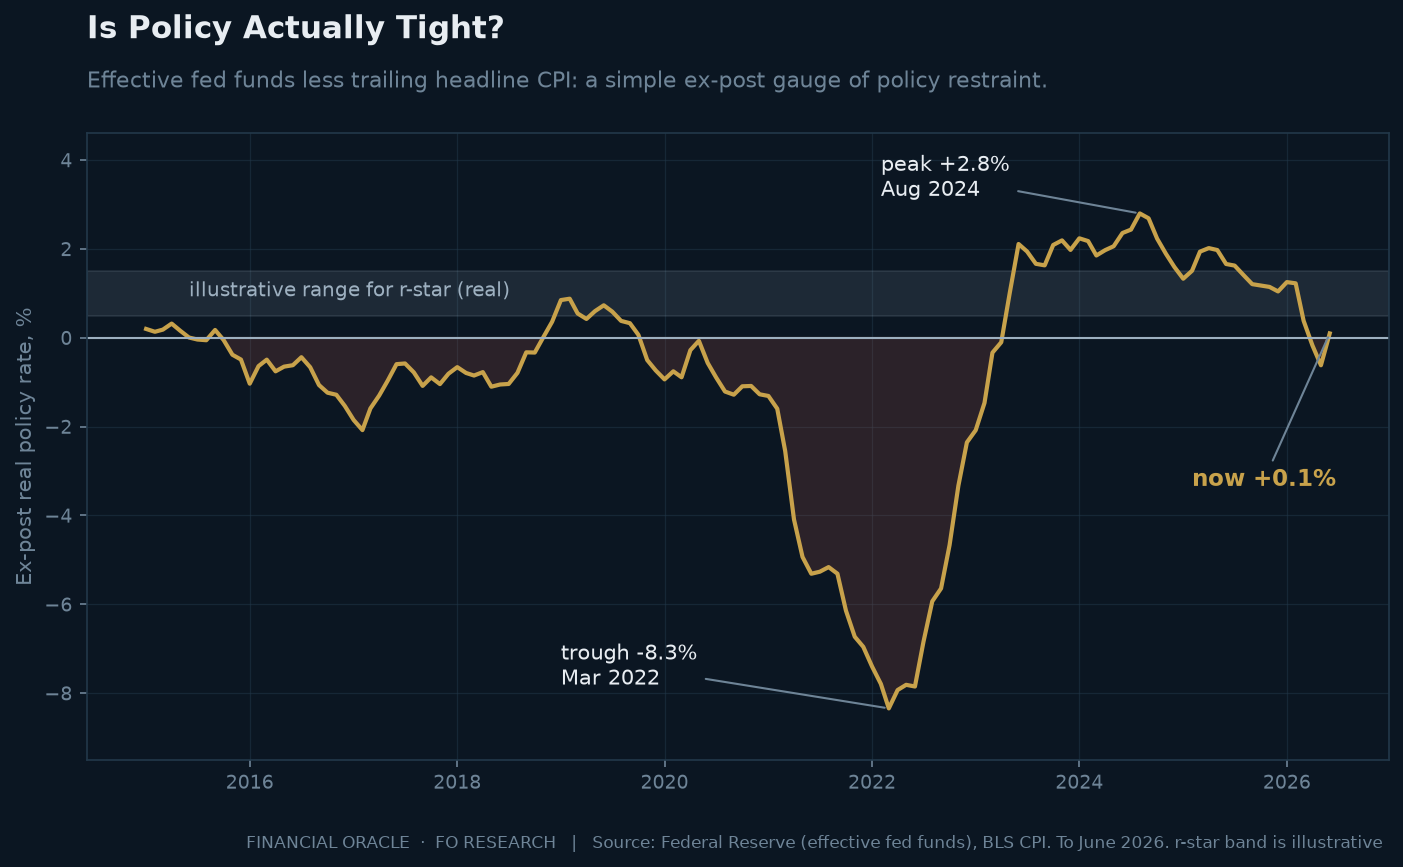
The effective fed funds rate averaged 3.63% in July 2026, with the target range at 3.50% to 3.75%. Headline CPI inflation ran at 3.5% in the year to June. On that simple ex-post CPI measure, the real policy rate was roughly +0.1%.
The trajectory is the story. In August 2024 the same measure peaked near +2.8%, comfortably restrictive against any conventional estimate of neutral. Two years later it is barely positive. Only part of that came from the Fed's 175 basis points of cuts; the rest came from inflation re-accelerating underneath a falling nominal rate. Policy loosened twice over, once by decision and once by arithmetic.
Different inflation measures change the precise level. Core inflation, expected inflation and PCE-based measures will not produce identical readings. But they do not alter the central point: the real-rate cushion has narrowed sharply from its 2024 peak.
Against prominent neutral-rate benchmarks around 1%, this simple gauge no longer signals clearly restrictive policy. It points to a stance much closer to neutral, and potentially below it, than the nominal-rate headline implies. That is a very different world from the one implied by headlines describing a central bank that has been "cutting from restrictive territory", and it is the quantitative floor under what the desk has called the box: the constraint that limits how much more easing is available before policy becomes actively stimulative into an inflation problem that has not gone away.
Why this is the argument underneath every rates debate
Almost every disagreement about Fed policy reduces to an implicit disagreement about neutral. A commentator arguing the Fed has "plenty of room to cut" is asserting a high real policy rate relative to a low r-star. A commentator warning that cuts are inflationary is asserting the opposite. Neither usually states the assumption, because stating it would expose how uncertain it is.
The reader's advantage is simply to ask the question directly: relative to what? Once the comparison is explicit, most confident rate forecasts reveal themselves as confident r-star forecasts, which is a much harder thing to be confident about. The desk's own dated reads on where that leaves policy are published and scored in the track record.
Frequently asked questions
What is r-star, in plain terms?
The real policy rate at which monetary policy neither stimulates nor restrains the economy, with inflation at target. Above it, policy is restrictive; below it, accommodative. It is a real, inflation-adjusted concept, not a nominal one.
Is monetary policy actually tight right now?
On the simple ex-post measure used here, policy is no longer clearly restrictive. The July effective fed funds rate of 3.63% less June headline CPI of 3.5% produces roughly +0.1%, down from about +2.8% in August 2024. Alternative inflation measures change the exact level, but not the substantial decline in real restraint.
How is r-star measured?
It is estimated, not measured. The best-known approach is the Holston-Laubach-Williams model published by the New York Fed, which infers neutral from growth, inflation and interest rates together. Market-implied forward real rates and the Fed's own longer-run projection offer alternatives. All carry wide uncertainty bands and are revised over time.
What makes the neutral rate rise or fall?
The balance of desired saving against desired investment. Ageing populations, slower productivity growth and strong demand for safe assets push it down; heavy government borrowing, a strong investment cycle and faster productivity growth push it up. It moves slowly, and it is not chosen by the central bank.
Why does r-star matter for investors?
Because it sets the anchor for where short rates settle over a cycle, which in turn anchors the expected-rate component of every long yield, and therefore the discount rate on every long-duration asset. A market that revises its view of neutral upward reprices bonds and equities together, which is why the argument matters well beyond the front end.
This explainer is part of the FO Research library. The desk publishes its market reads before the print, dates them, and scores them against the tape afterwards. We read the data. We call the paths.


The research is Premium. The record is public.
Every Brief and Analysis in full: the scenario maps with explicit invalidation, the cross-asset tactical reads, the desk-formatted PDFs, and a scorecard where every call is dated before the print and scored after it, misses included. Inspect the record before you pay for it.
Subscribe to Premium →Not ready? Get the teasers by email, free · New to the mechanics? Learn is open to everyone.