Explainer
How to Read a CPI Report: Headline, Core and Supercore
The short answer: a US CPI report gives three numbers worth reading, in this order. Start with core month on month, a closely watched measure of underlying inflation momentum, and compare it with expectations. Then look at supercore, services excluding housing rents, for clues about persistent domestic price pressure. Read headline last: it is the number in the news, but the one most moved by energy and food. Read each on the monthly change for momentum and the annual rate for the longer-run pace. Slowing inflation means prices rising more slowly, not prices falling.
The next report, for September, is released by the Bureau of Labor Statistics at 08:30 New York time on Wednesday 14 October 2026. The August report put headline at 3.4 per cent over the year, core at 2.4 per cent and services less rent of shelter, the published series closest to supercore, at 3.1 per cent. Those three figures tell three different stories, which is the point of reading all of them.
| Read the print with the desk |
| New Learn explainers reach the free list in full. Every Brief and Analysis arrives as a teaser with a full contents list; Premium unlocks the complete research. Join the free list, no card required. |
What the three numbers measure
Headline CPI is the change in the price of the full consumer basket: food, energy, goods, rents, services. It is what households feel and what most reports lead with. Its weakness as a signal is that two of its components, energy and food, swing on supply shocks that monetary policy cannot do much about.
Core CPI is the same index excluding food and energy. Nothing about food and energy is unimportant; they are removed because they are volatile, so that what is left shows the trend more clearly. When headline and core part company, core is usually the better guide to where headline settles once the shock passes.
Supercore is a market shorthand for core services inflation excluding housing. Federal Reserve officials most commonly examine this category within the PCE price index. A related CPI measure removes energy services and shelter, but the Bureau does not publish that precise aggregate directly. The closest published series is services less rent of shelter, which removes housing rents but still contains energy services such as electricity and utility gas. That matters in an energy shock, so this explainer labels the 3.1 per cent figure by its published name and treats it as a broader proxy. What is left after removing housing is mostly services such as medical care, transport, insurance and recreation. Many of these are labour-intensive, so the measure gives clues about persistent domestic price pressure. It is not a direct measure of wages: energy, insurance costs and administered prices move it too.
Two clocks: month on month and year on year
Every one of the three numbers comes on two clocks. The year on year rate compares this month’s index with the same month a year earlier. It is the number commentary compares with 2 per cent, although the Federal Reserve formally targets 2 per cent on the PCE price index, not CPI. It is also slow: it carries eleven months of history, and it can rise or fall simply because of what happened a year ago, the so-called base effect.
The month on month change compares this month with last month, on seasonally adjusted data. It is noisy, but it is where the news is. A core reading of 0.2 per cent a month compounds to roughly 2.4 per cent a year; 0.3 compounds to about 3.7; 0.4 to about 4.9. That is why one tenth of a point on monthly core can move the two-year Treasury yield more than a much larger surprise in the annual headline.
| Monthly core, annualised: the rule of thumb | |
| 0.2% | About 2.4 per cent a year. If sustained, consistent with inflation drifting back towards target. |
| 0.3% | About 3.7 per cent a year. A sustained pace around 3.7 per cent annualised would complicate the case for easing. |
| 0.4% | About 4.9 per cent a year. If sustained, strengthens the case for tighter policy and can move the front end. |
The 2026 case: when headline and core parted company
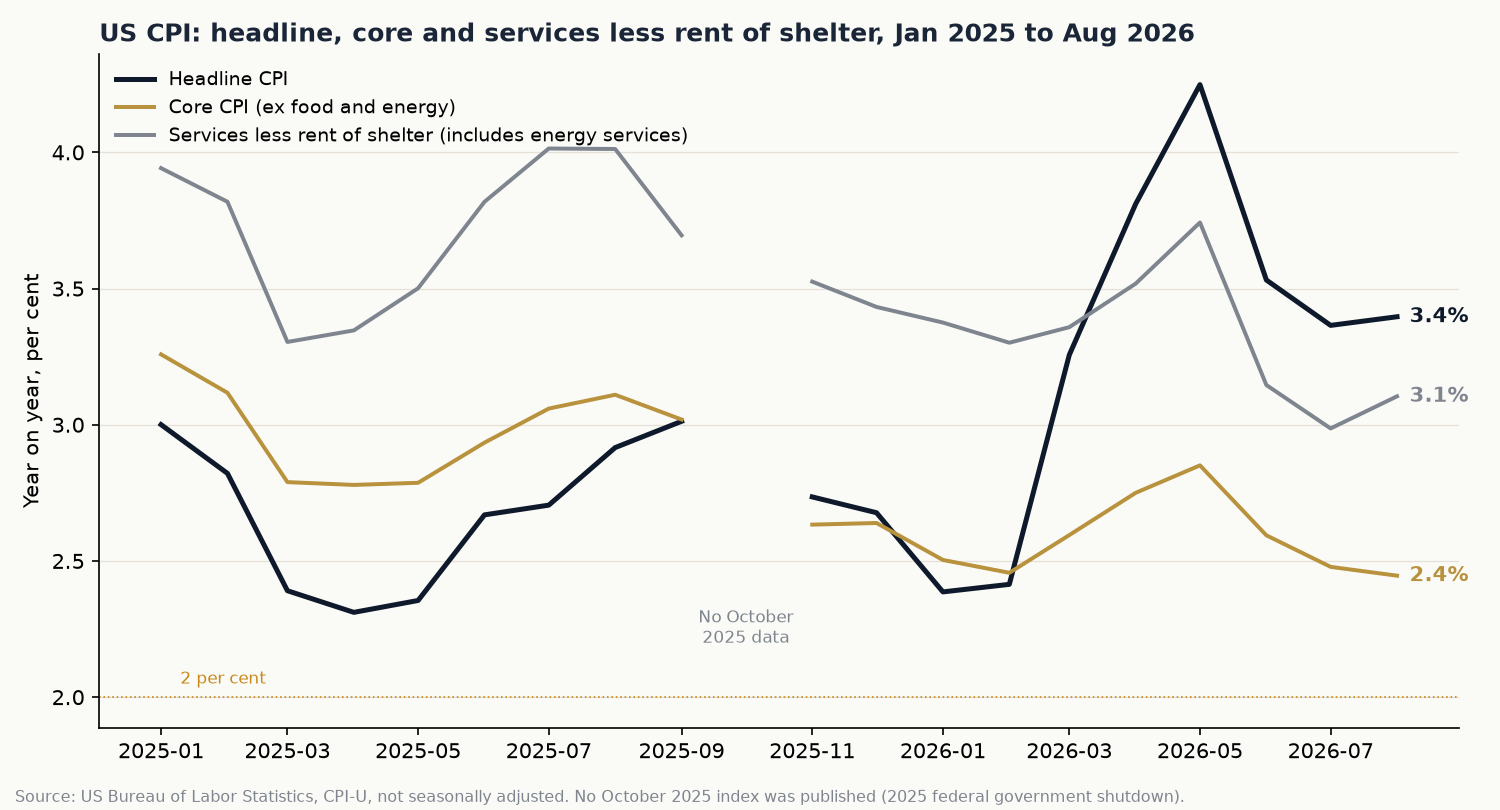
2026 gave a clean demonstration of why the three numbers need reading together. In January headline was running at 2.4 per cent and core at 2.5. Then the energy shock arrived. Headline jumped 0.9 per cent in March alone on a seasonally adjusted basis and by May was running at 4.2 per cent year on year. Core over the same months rose only from 2.5 to 2.9 per cent.
Ahead of the May report the desk’s Brief The Floor Meets the Print set out exactly that tension: the month was set to cool while the year re-accelerated on base effects. Then June delivered the reverse shock. Prices fell 0.4 per cent on the month as energy unwound, headline dropped to 3.5 per cent and core to 2.6, and the desk’s Brief The Disinflation Arrives. The Floor Doesn’t Break. read the rally that followed as concentrated at the front of the curve rather than a break in long yields.
By August the picture had settled into a pattern a reader can use: headline 3.4 per cent, still carrying energy; core 2.4 per cent, back near where it started the year; services less rent of shelter 3.1 per cent, firmer than core, with services outside housing rising faster than goods. Three numbers, one report, three different answers to the question “how much inflation is there?”
What to look for on the day
- Core month on month against consensus. A surprise of a tenth of a percentage point can be market-moving, particularly when it changes expectations for Federal Reserve policy. Check the second decimal: a 0.26 rounds to 0.3 but reads very differently from a 0.34.
- Services excluding housing, month on month. Rising non-housing services inflation alongside flat core goods suggests price pressure is concentrated in services. Check the components, including energy services, before attributing it to labour costs.
- Headline against core. A wide gap points to energy or food. Ask whether the shock is feeding into core, for example through transport fares or airline prices, or staying contained.
- Shelter. Housing rents are roughly a third of the basket and move slowly, so a shift in shelter changes the core trend for months.
- Revisions and seasonal factors. The Bureau revises seasonal factors each February. A month that looks hot may be a seasonal artefact.
For tomorrow’s report, published forecasts sit at about 3.6 to 3.7 per cent for headline and 2.4 to 2.5 per cent for core (newswires, 12 October 2026). Headline is expected to rise while core holds, which is the energy pattern again.
How the desk uses it
The desk does not trade a CPI number; it registers in advance what a print would change. Today’s Brief, Gold Lost the Line. The Dollar Kept the Case., names Wednesday’s September CPI as the next dated trigger for its gold call. Gold settled near 4,194 on Friday 9 October, under the 4,449 line the desk registered in August, with the two-year Treasury leading yields higher: the dollar case of the two. The CPI question for that call is not whether headline is high but whether the core and services detail keeps the front end of the curve pricing a firmer policy path.
Every call of that kind is dated before the data and scored against the market afterwards, misses included, on the desk’s call record at /calls. The method is set out in How the Desk Scores Its Calls.
Frequently asked questions
What is the difference between headline and core CPI?
Headline CPI measures price changes across the whole consumer basket. Core CPI removes food and energy because they are volatile and driven by supply shocks. Core is the better guide to the underlying trend; headline is the better guide to what households are paying.
What is supercore inflation?
Supercore is a market shorthand for core services inflation excluding housing, a category Federal Reserve officials most commonly examine within the PCE price index. It is not an official CPI series. The nearest published Bureau of Labor Statistics series, services less rent of shelter, still includes energy services, so it is a broader proxy. It is watched because many of those services are labour-intensive, which makes it a clue to persistent domestic price pressure rather than a direct wage measure.
Why does the Federal Reserve target PCE and not CPI?
The Federal Reserve’s 2 per cent target is defined on the personal consumption expenditures price index, which has broader coverage and different weights, with a smaller weight on housing. CPI is generally published ahead of the corresponding PCE report, often by roughly two to three weeks, so markets use it to update their estimates of PCE. For September 2026, CPI is due on 14 October and PCE on 29 October.
Why is month on month CPI more important than the annual rate?
The annual rate carries eleven months of old data and can move on base effects alone. The monthly change shows current momentum. Annualising monthly core, roughly multiplying by twelve, shows what pace inflation is running at now.
What time is the CPI report released?
The Bureau of Labor Statistics publishes CPI at 08:30 New York time, usually in the second week of the month following the reference month. The September 2026 report is due on Wednesday 14 October 2026.
| From explainer to callNew Learn explainers reach the free list in full, and every Brief and Analysis arrives as a teaser with its contents list. Join the free list · inspect every dated, scored call at /calls · FO Premium, $49 a month, unlocks every Brief and Analysis in full, with the scenario paths, levels, triggers and invalidation criteria behind each call. |
This explainer is part of the FO Research library. The desk publishes its market reads before the print, dates them, and scores them against the tape afterwards. We read the data. We call the paths.


Get the next explainer by email.
Free, no card required. Your email also opens the full FO News Live view, the FO view on the calendar, the full positioning check and surprise alerts by email.
Join free