Explainer
Dr. Copper and Real Assets: What the Metal Is Really Diagnosing
Copper is nicknamed Dr. Copper because its uses run through almost every part of the physical economy, so its price has often moved with the global growth cycle. Wiring, plumbing, motors, grids and construction all consume it, which makes demand broad rather than sector-specific. That breadth is the whole of the claim, and it is a good claim. But a price is set by supply as well as demand, and when the supply side or the demand mix changes structurally, the diagnosis gets harder to read. That is precisely where copper sits now.
Why the nickname was earned
Most commodities tell you about their own market. Copper's usefulness is that its end-uses are diversified enough that no single sector dominates the signal. When construction, manufacturing and infrastructure are all expanding at once, copper demand rises in a way that is difficult to fake and difficult to hide. It responds without waiting for a statistical agency, which is what gives it a real-time quality that official data cannot match.
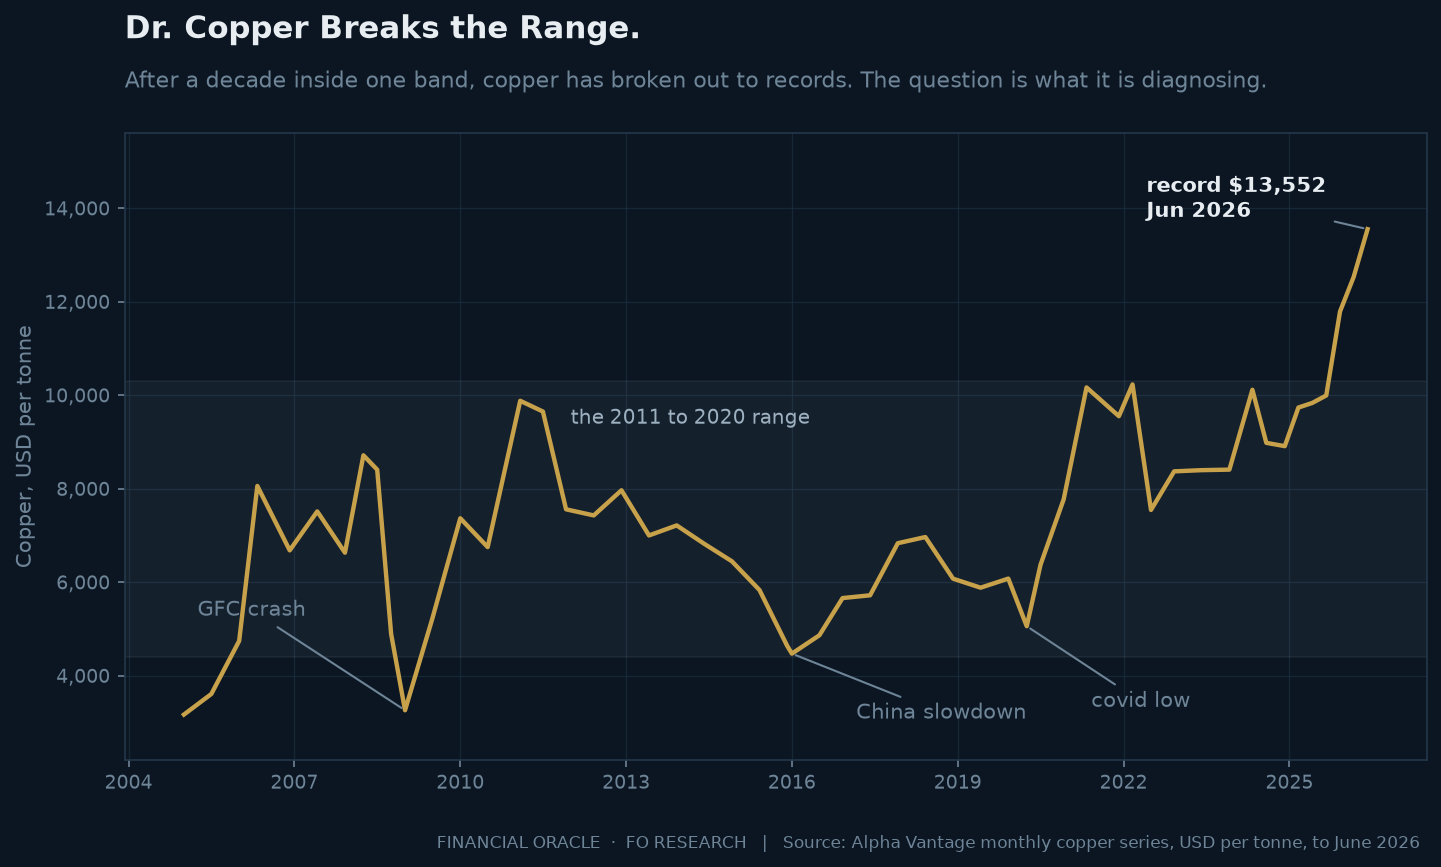
The record supports the reputation at turning points. Copper collapsed from about $8,400 a tonne in July 2008 to roughly $3,260 in January 2009 as the financial crisis hit, a fall of about 61%. It fell again into the China industrial slowdown, reaching about $4,470 in January 2016. It dropped to roughly $5,060 in April 2020 as the pandemic shut activity down. In each case the metal moved early and moved hard.
The desk treats it as one input rather than an oracle, for the same reason it treats the yield curve that way: a signal with a good record is still a signal, not a mechanism, and its record was compiled in a world that may no longer hold.
What is different now
Copper traded inside a broad band for most of the decade from 2011 to 2020. It has since broken decisively above it. As of June 2026, the latest observation available in the cited series, the monthly copper price stood at about $13,552 a tonne, roughly 38% higher than a year earlier and about 168% above the April 2020 low. That is not a modest cyclical recovery. It is a different regime.
Read naively, Dr. Copper is diagnosing a global boom. The desk does not think that is the whole story, for two reasons.
The demand mix has changed. Electrification, grid build-out, and the datacentre construction driving the artificial-intelligence capital-expenditure cycle are copper-intensive in a way that is structural rather than cyclical. That demand does not wax and wane with the ordinary manufacturing cycle, so its contribution to price is not a growth signal in the traditional sense. The desk's work on that capex cycle sits in Held Out for the IPOs.
The supply side is constrained. New mines take many years to permit and build, ore grades at existing mines have been declining, and the incentive price required to bring meaningful new supply forward has risen. When supply is inelastic, any given increment of demand produces a larger price move. Some of what looks like a demand signal is a supply constraint wearing a demand costume.
The honest conclusion is the same shape as the one the desk reached on the yield curve: the signal is noisier, not useless. Copper still says something real about physical activity. It now also says something about electrification and about mine supply, and separating those three requires more than reading the price.
Real assets and the inflation-hedge question
Copper belongs to the broader category investors call real assets: claims on physical things rather than on nominal cash flows. The category is routinely sold as an inflation hedge, which is true enough to be dangerous, because the label hides more than it reveals.
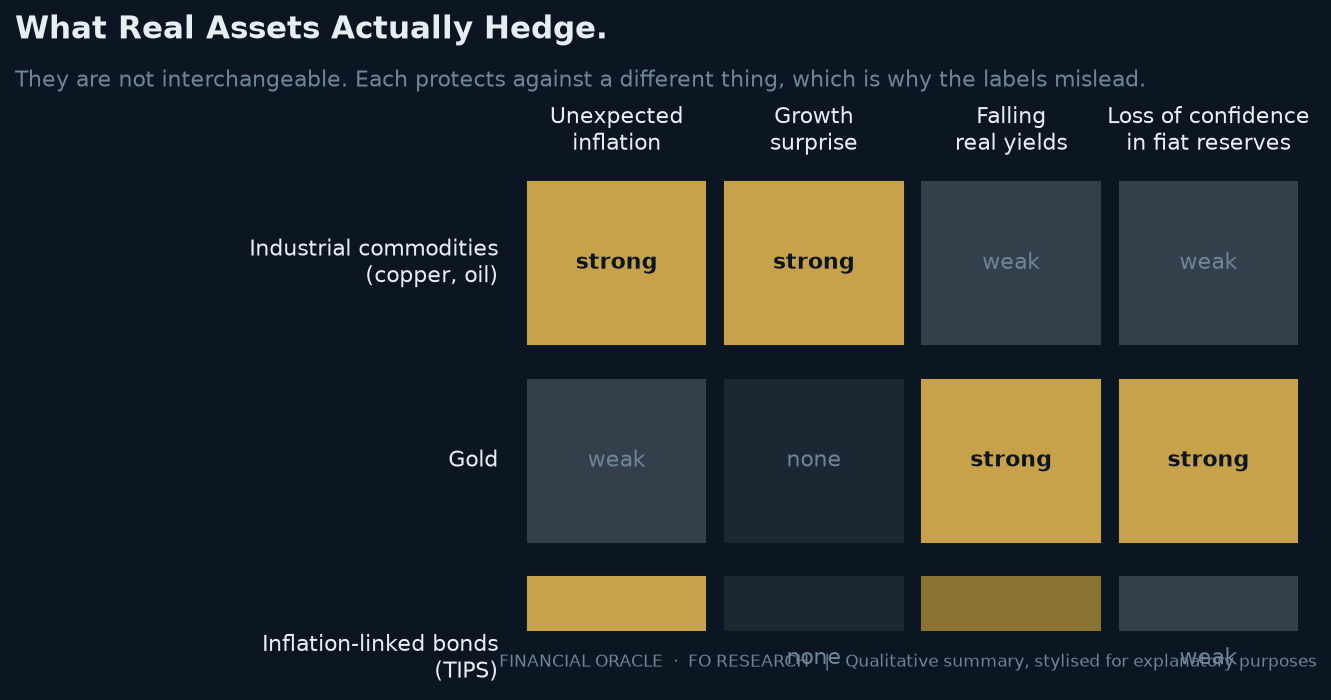
The useful distinction is between expected and unexpected inflation. Expected inflation is generally reflected in market prices and nominal yields, while the larger portfolio shock comes when inflation exceeds what was priced. That is where industrial commodities have historically offered their strongest protection. When inflation arrives through the goods and energy channel, the things being repriced are precisely the things commodity exposure owns.
The costs are equally real. Physical commodities produce no income, while futures-based exposure depends on collateral returns and the cost or benefit of rolling contracts. They are volatile enough that how much of them an investor owns usually matters more than being right about direction. And they can spend years falling in real terms when the supply cycle turns, as copper did between 2011 and 2016. A real asset is not a safe asset.
The category is also not homogeneous, which is the most common error. Industrial commodities hedge growth and unexpected goods inflation. Gold does something quite different: it responds to real yields and to confidence in fiat reserves, the mechanism set out in Gold vs Real Yields. Inflation-linked bonds hedge measured consumer inflation contractually but carry duration risk. Three assets, three different jobs, one misleading label.
How the desk reads it
Copper is treated as a cross-check rather than a lead indicator. Three questions do most of the work. Whether copper is moving with or against the other growth-sensitive markets, because a move confined to one metal is a supply story while a broad move is a demand story. Whether inventories are building or drawing, because that separates physical tightness from financial positioning. And whether the move is confirmed in credit, since high-yield spreads remain the cleanest cross-check the desk applies to any growth signal.
Applied to the present configuration, a record copper price alongside a structural electrification bid and constrained mine supply is not, on its own, evidence of a booming global manufacturing cycle. It is evidence that the metal is being repriced for a decade of demand that the supply base was not built for. Those are different claims with different investment consequences, and the desk's dated reads on which is dominant are published and scored in the track record.
Frequently asked questions
Why is copper called Dr. Copper?
Because its end-uses span construction, manufacturing, power grids and transport, so demand reflects the breadth of the physical economy rather than one sector. That gave the price a reputation for signalling turns in the global growth cycle earlier than official statistics, as though it held a doctorate in economics.
Is copper still a reliable leading indicator?
It remains informative but is harder to read than it was. Structural electrification and datacentre demand, alongside constrained mine supply, now contribute to the price for reasons unrelated to the ordinary growth cycle. The signal is noisier, not useless, and is best used as a cross-check alongside credit and inventories.
Are commodities a good inflation hedge?
They have historically hedged unexpected inflation, particularly when it arrives through goods and energy, which is the kind that damages conventional portfolios. They do not hedge expected inflation, because that is already priced. They also pay no income and are highly volatile, so they are a hedge with a real carrying cost.
What is the difference between gold and industrial commodities as real assets?
They protect against different risks. Industrial commodities respond to growth and to unexpected goods inflation. Gold responds primarily to real yields and to confidence in fiat reserves, which is why it can rise while industrial metals fall. Grouping them as one asset class obscures the distinction.
What is copper's price now and what does it mean?
The monthly copper price was about $13,552 a tonne in June 2026, roughly 38% above a year earlier and about 168% above the April 2020 low, a record that breaks decisively above the 2011 to 2020 range. The desk reads that as reflecting structural electrification demand and constrained supply as much as cyclical strength.
This explainer is part of the FO Research library. The desk publishes its market reads before the print, dates them, and scores them against the tape afterwards. We read the data. We call the paths.
The research is Premium. The record is public.
Every Brief and Analysis in full: the scenario maps with explicit invalidation, the cross-asset tactical reads, the desk-formatted PDFs, and a scorecard where every call is dated before the print and scored after it, misses included. Inspect the record before you pay for it.
Subscribe to Premium →Not ready? Get the teasers by email, free · New to the mechanics? Learn is open to everyone.